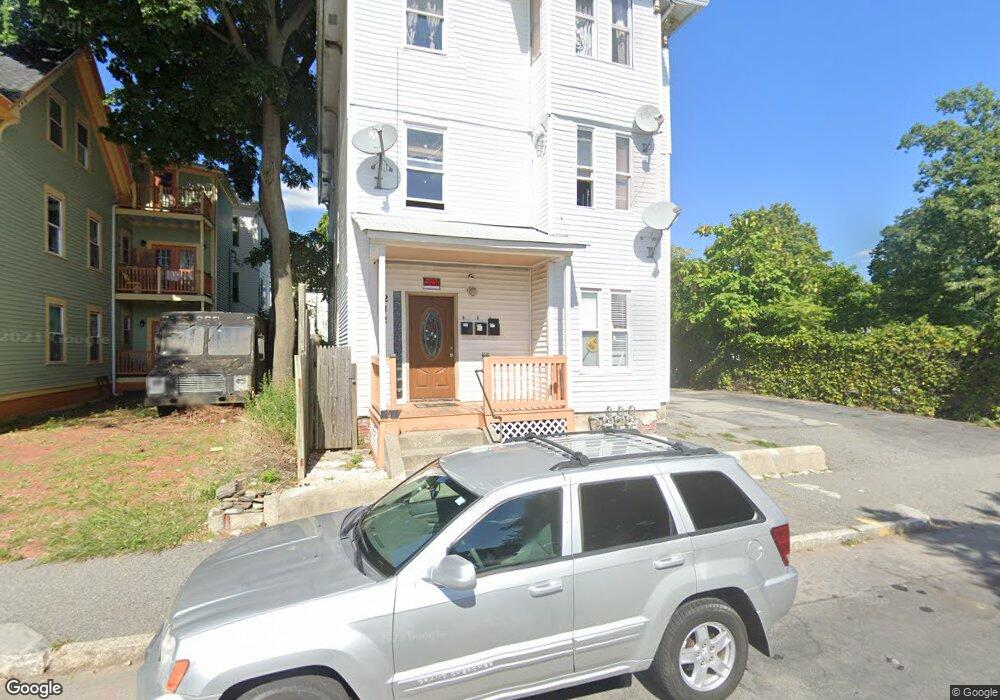
212 Austin St Worcester, MA 01609
Elm Park NeighborhoodEstimated Value: $733,000 - $909,000
9
Beds
3
Baths
4,128
Sq Ft
$199/Sq Ft
Est. Value
About This Home
This home is located at 212 Austin St, Worcester, MA 01609 and is currently estimated at $821,000, approximately $198 per square foot. 212 Austin St is a home located in Worcester County with nearby schools including Jacob Hiatt Magnet School, Chandler Magnet, and Elm Park Elementary School.
Ownership History
Date
Name
Owned For
Owner Type
Purchase Details
Closed on
Sep 6, 2018
Sold by
Smallwood Philip B
Bought by
Woekolo Yassah C
Current Estimated Value
Purchase Details
Closed on
Aug 8, 2013
Sold by
Woekolo Yassah C
Bought by
Smallwood Philip B
Purchase Details
Closed on
Oct 14, 2011
Sold by
Smallwood Dewoe W
Bought by
Woekolo Yassah C
Purchase Details
Closed on
Oct 13, 1994
Sold by
Fhlmc
Bought by
Smallwood Dewoe W
Home Financials for this Owner
Home Financials are based on the most recent Mortgage that was taken out on this home.
Original Mortgage
$40,350
Interest Rate
8.43%
Mortgage Type
Purchase Money Mortgage
Purchase Details
Closed on
Jun 1, 1994
Sold by
Gonzalez Neftali
Bought by
Citicorp Mtg Inc
Create a Home Valuation Report for This Property
The Home Valuation Report is an in-depth analysis detailing your home's value as well as a comparison with similar homes in the area
Home Values in the Area
Average Home Value in this Area
Purchase History
| Date | Buyer | Sale Price | Title Company |
|---|---|---|---|
| Woekolo Yassah C | -- | -- | |
| Smallwood Philip B | -- | -- | |
| Woekolo Yassah C | -- | -- | |
| Smallwood Dewoe W | $42,500 | -- | |
| Citicorp Mtg Inc | $73,070 | -- |
Source: Public Records
Mortgage History
| Date | Status | Borrower | Loan Amount |
|---|---|---|---|
| Previous Owner | Citicorp Mtg Inc | $40,350 |
Source: Public Records
Tax History
| Year | Tax Paid | Tax Assessment Tax Assessment Total Assessment is a certain percentage of the fair market value that is determined by local assessors to be the total taxable value of land and additions on the property. | Land | Improvement |
|---|---|---|---|---|
| 2025 | $7,368 | $558,600 | $71,500 | $487,100 |
| 2024 | $6,772 | $492,500 | $71,500 | $421,000 |
| 2023 | $6,427 | $448,200 | $57,400 | $390,800 |
| 2022 | $5,596 | $367,900 | $45,900 | $322,000 |
| 2021 | $4,990 | $306,500 | $36,700 | $269,800 |
| 2020 | $4,600 | $270,600 | $36,800 | $233,800 |
| 2019 | $4,149 | $230,500 | $36,300 | $194,200 |
| 2018 | $4,052 | $214,300 | $36,300 | $178,000 |
| 2017 | $3,798 | $197,600 | $36,300 | $161,300 |
| 2016 | $3,702 | $179,600 | $29,800 | $149,800 |
| 2015 | $3,605 | $179,600 | $29,800 | $149,800 |
| 2014 | $3,509 | $179,600 | $29,800 | $149,800 |
Source: Public Records
Map
Nearby Homes
Your Personal Tour Guide
Ask me questions while you tour the home.