Estimated Value: $393,000 - $491,000
4
Beds
3
Baths
2,181
Sq Ft
$199/Sq Ft
Est. Value
About This Home
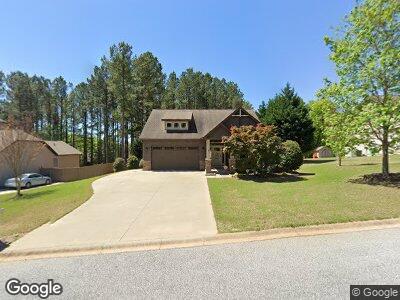
This home is located at 212 Bayswater Ln, Greer, SC 29651 and is currently estimated at $434,534, approximately $199 per square foot. 212 Bayswater Ln is a home located in Greenville County with nearby schools including Skyland Elementary School, Blue Ridge Middle School, and Blue Ridge High School.
Ownership History
Date
Name
Owned For
Owner Type
Purchase Details
Closed on
Sep 29, 2014
Sold by
Abrahamsen Donald A and Abrahamsen Carolyn
Bought by
Butler Jeremy K and Butler Elizabeth T
Current Estimated Value
Home Financials for this Owner
Home Financials are based on the most recent Mortgage that was taken out on this home.
Original Mortgage
$220,400
Outstanding Balance
$172,753
Interest Rate
4.17%
Mortgage Type
New Conventional
Estimated Equity
$258,861
Purchase Details
Closed on
Mar 26, 2010
Sold by
Rosewood Of The Piedmont Inc
Bought by
Abrahamsen Donald A and Abrahamsen Carolyn
Home Financials for this Owner
Home Financials are based on the most recent Mortgage that was taken out on this home.
Original Mortgage
$145,600
Interest Rate
5.02%
Mortgage Type
New Conventional
Create a Home Valuation Report for This Property
The Home Valuation Report is an in-depth analysis detailing your home's value as well as a comparison with similar homes in the area
Home Values in the Area
Average Home Value in this Area
Purchase History
| Date | Buyer | Sale Price | Title Company |
|---|---|---|---|
| Butler Jeremy K | $232,000 | -- | |
| Abrahamsen Donald A | $219,520 | -- |
Source: Public Records
Mortgage History
| Date | Status | Borrower | Loan Amount |
|---|---|---|---|
| Open | Butler Jeremy K | $220,400 | |
| Previous Owner | Abrahamsen Donald A | $43,600 | |
| Previous Owner | Abrahamsen Donald A | $145,600 | |
| Previous Owner | Rosewood Of The Piedmont Inc | $173,480 |
Source: Public Records
Tax History Compared to Growth
Tax History
| Year | Tax Paid | Tax Assessment Tax Assessment Total Assessment is a certain percentage of the fair market value that is determined by local assessors to be the total taxable value of land and additions on the property. | Land | Improvement |
|---|---|---|---|---|
| 2024 | $1,707 | $10,340 | $1,240 | $9,100 |
| 2023 | $1,707 | $10,340 | $1,240 | $9,100 |
| 2022 | $1,591 | $10,340 | $1,240 | $9,100 |
| 2021 | $1,575 | $10,340 | $1,240 | $9,100 |
| 2020 | $1,448 | $8,990 | $1,080 | $7,910 |
| 2019 | $1,439 | $8,990 | $1,080 | $7,910 |
| 2018 | $1,436 | $8,990 | $1,080 | $7,910 |
| 2017 | $1,401 | $8,990 | $1,080 | $7,910 |
| 2016 | $1,344 | $224,790 | $27,000 | $197,790 |
| 2015 | $1,344 | $224,790 | $27,000 | $197,790 |
| 2014 | $1,250 | $214,040 | $27,000 | $187,040 |
Source: Public Records
Map
Nearby Homes
- 3615 Pennington Rd
- 3619 Pennington Rd
- 3621 Pennington Rd
- 30 Arbolado Way
- 3400 Pennington Rd
- 3825 N Highway 101
- 120 Care Ln
- 5 Hunters Landing Dr
- 2349 Mays Bridge Rd
- 3709 Spearman Dr
- 113 Glastonbury Dr
- 205 Glastonbury Dr
- 3900 N Highway 101
- 3902 N Highway 101
- 3836 Pennington Rd
- 200 Noble St
- 3838 Pennington Rd
- 205 Novelty Dr
- 305 Novelty Dr
- 203 Glendon St
- 212 Bayswater Ln
- 216 Bayswater Ln
- 208 Bayswater Ln
- 204 Bayswater Ln
- 2 Pebblebrook Ct
- 8 Pebblebrook Ct
- 213 Bayswater Ln
- 217 Bayswater Ln
- 209 Bayswater Ln
- 300 Bayswater Ln
- 200 Bayswater Ln
- 221 Bayswater Ln
- 16 Pebblebrook Ct
- 1 Arbolado Way
- 205 Bayswater Ln
- 9 Arbolado Way
- 9 Pebblebrook Ct
- 225 Bayswater Ln
- 201 Bayswater Ln
- 15 Arbolado Way