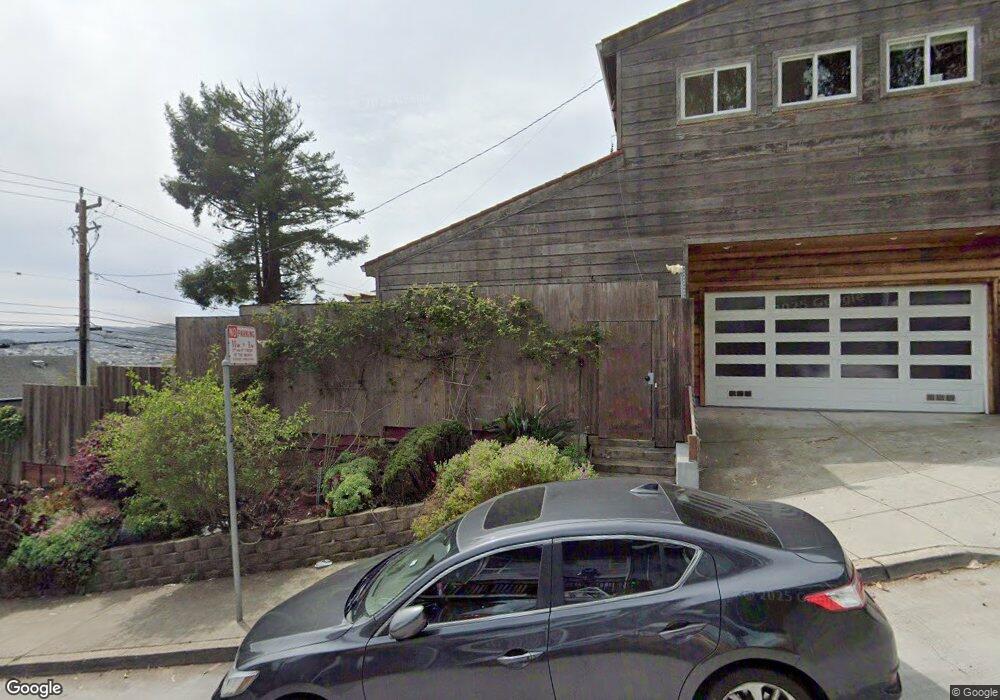
212 Bemis St San Francisco, CA 94131
Glen Park NeighborhoodEstimated Value: $1,894,926 - $2,394,000
3
Beds
3
Baths
1,970
Sq Ft
$1,127/Sq Ft
Est. Value
About This Home
This home is located at 212 Bemis St, San Francisco, CA 94131 and is currently estimated at $2,219,482, approximately $1,126 per square foot. 212 Bemis St is a home located in San Francisco County with nearby schools including Glen Park Elementary School, James Lick Middle School, and St John Catholic School.
Ownership History
Date
Name
Owned For
Owner Type
Purchase Details
Closed on
Aug 22, 2022
Sold by
Revocabl Peter and Revocabl Rose
Bought by
Rose East-Bratt Revocable Trust
Current Estimated Value
Purchase Details
Closed on
Nov 11, 2021
Sold by
East Bratt Rose
Bought by
East Bratt Rose and Peter Bratt And Rose East Brat
Purchase Details
Closed on
Sep 17, 2012
Sold by
Cavagnaro Paul A
Bought by
East Bratt Kellie
Home Financials for this Owner
Home Financials are based on the most recent Mortgage that was taken out on this home.
Original Mortgage
$50,000
Interest Rate
3.59%
Mortgage Type
Unknown
Purchase Details
Closed on
May 24, 2011
Sold by
Bratt Peter and East Bratt Rose
Bought by
Bratt Peter and East Bratt Rose
Home Financials for this Owner
Home Financials are based on the most recent Mortgage that was taken out on this home.
Original Mortgage
$676,000
Interest Rate
4.84%
Mortgage Type
New Conventional
Purchase Details
Closed on
May 13, 2011
Sold by
Cavagnaro Paul
Bought by
East Bratt Kellie
Home Financials for this Owner
Home Financials are based on the most recent Mortgage that was taken out on this home.
Original Mortgage
$676,000
Interest Rate
4.84%
Mortgage Type
New Conventional
Purchase Details
Closed on
Mar 17, 2011
Sold by
Bratt Peter and East Bratt Rose
Bought by
Bratt Peter and East Bratt Rose
Purchase Details
Closed on
Dec 6, 2007
Sold by
Bratt Peter and East Bratt Rose
Bought by
Bratt Peter and East Bratt Rose
Home Financials for this Owner
Home Financials are based on the most recent Mortgage that was taken out on this home.
Original Mortgage
$670,000
Interest Rate
6.26%
Mortgage Type
New Conventional
Purchase Details
Closed on
Jun 20, 2003
Sold by
Bratt Peter and East Bratt Rose
Bought by
Bratt Peter and East Bratt Rose
Home Financials for this Owner
Home Financials are based on the most recent Mortgage that was taken out on this home.
Original Mortgage
$138,500
Interest Rate
5.37%
Mortgage Type
Purchase Money Mortgage
Purchase Details
Closed on
May 17, 2002
Sold by
Bratt Peter and East Bratt Rose
Bought by
Bratt Peter and East Bratt Rose
Home Financials for this Owner
Home Financials are based on the most recent Mortgage that was taken out on this home.
Original Mortgage
$135,250
Interest Rate
6.94%
Purchase Details
Closed on
Jul 26, 1995
Sold by
Bratt Peter W and East Bratt Rose M
Bought by
Bratt Peter and East Bratt Rose
Create a Home Valuation Report for This Property
The Home Valuation Report is an in-depth analysis detailing your home's value as well as a comparison with similar homes in the area
Home Values in the Area
Average Home Value in this Area
Purchase History
| Date | Buyer | Sale Price | Title Company |
|---|---|---|---|
| Rose East-Bratt Revocable Trust | -- | -- | |
| East Bratt Rose | -- | None Available | |
| East Bratt Kellie | -- | Chicago Title Company | |
| Bratt Peter | $112,500 | First American Title Company | |
| East Bratt Kellie | -- | First American Title Company | |
| Bratt Peter | -- | None Available | |
| Bratt Peter | -- | Fidelity National Title Co | |
| Bratt Peter | -- | Fidelity National Title Co | |
| Bratt Peter | -- | Fidelity National Title Co | |
| Bratt Peter | -- | Fidelity National Title Co | |
| Bratt Peter | -- | Fidelity National Title Co | |
| Bratt Peter | -- | -- |
Source: Public Records
Mortgage History
| Date | Status | Borrower | Loan Amount |
|---|---|---|---|
| Previous Owner | East Bratt Kellie | $50,000 | |
| Previous Owner | East Bratt Kellie | $625,500 | |
| Previous Owner | Bratt Peter | $676,000 | |
| Previous Owner | Bratt Peter | $670,000 | |
| Previous Owner | Bratt Peter | $138,500 | |
| Previous Owner | Bratt Peter | $135,250 |
Source: Public Records
Tax History
| Year | Tax Paid | Tax Assessment Tax Assessment Total Assessment is a certain percentage of the fair market value that is determined by local assessors to be the total taxable value of land and additions on the property. | Land | Improvement |
|---|---|---|---|---|
| 2025 | $7,589 | $658,254 | $46,152 | $612,102 |
| 2024 | $7,589 | $645,350 | $45,248 | $600,102 |
| 2023 | $7,480 | $632,699 | $44,362 | $588,337 |
| 2022 | $7,346 | $620,296 | $43,493 | $576,803 |
| 2021 | $7,219 | $608,138 | $42,642 | $565,496 |
| 2020 | $7,241 | $601,905 | $42,206 | $559,699 |
| 2019 | $6,992 | $590,106 | $41,379 | $548,727 |
| 2018 | $6,758 | $578,538 | $40,569 | $537,969 |
| 2017 | $6,678 | $567,196 | $39,774 | $527,422 |
| 2016 | $6,554 | $556,077 | $38,995 | $517,082 |
| 2015 | $6,740 | $547,727 | $38,410 | $509,317 |
| 2014 | $6,303 | $537,000 | $37,658 | $499,342 |
Source: Public Records
Map
Nearby Homes
- 37 Sussex St
- 360 Laidley St Unit 362
- 31 Natick St
- 88 Glen Ct
- 37 Miguel St Unit 6
- 25 Brompton Ave
- 29 Cuvier St
- 227 Whitney St
- 257 Chenery St
- 55 Hiliritas Ave
- 1729 Noe St
- 19 Joost Ave
- 57 Cayuga Ave
- 95 Ora Way Unit 303F
- 375 Day St
- 3755-3759 Mission St
- 111 Joost Ave
- 45 Ora Way Unit 204A
- 320 College Ave
- 44 Patton St
Your Personal Tour Guide
Ask me questions while you tour the home.