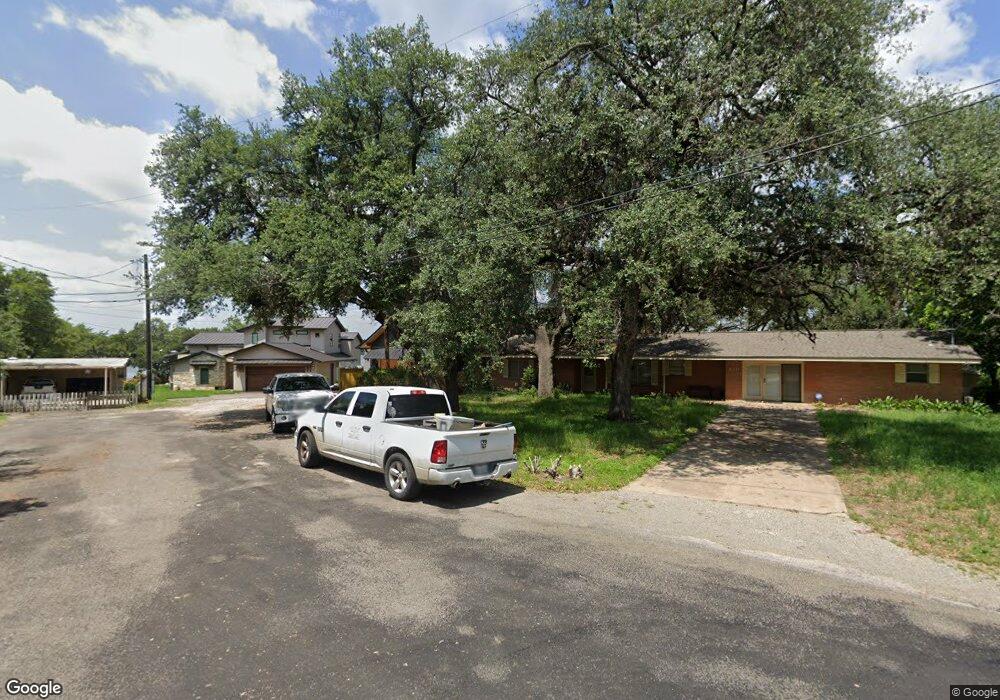
212 Bluebird Cir Unit on Lake LBJ Marble Falls, TX 78654
Estimated Value: $1,086,000 - $2,578,000
--
Bed
2
Baths
3,902
Sq Ft
$470/Sq Ft
Est. Value
About This Home
This home is located at 212 Bluebird Cir Unit on Lake LBJ, Marble Falls, TX 78654 and is currently estimated at $1,832,000, approximately $469 per square foot. 212 Bluebird Cir Unit on Lake LBJ is a home located in Burnet County with nearby schools including Highland Lakes Elementary School, Marble Falls Middle School, and Marble Falls High School.
Ownership History
Date
Name
Owned For
Owner Type
Purchase Details
Closed on
Jul 23, 2020
Sold by
Hardisty Thomas E and Hardisty Lura Poehl
Bought by
Burkett Beau and Burkett Lauren
Current Estimated Value
Home Financials for this Owner
Home Financials are based on the most recent Mortgage that was taken out on this home.
Original Mortgage
$756,000
Outstanding Balance
$670,371
Interest Rate
3.1%
Mortgage Type
New Conventional
Estimated Equity
$1,161,629
Purchase Details
Closed on
Jun 16, 2006
Sold by
Cardiff T C and Cardiff Nancy H
Bought by
Hardisty Thomas E and Hardisty Connie L
Home Financials for this Owner
Home Financials are based on the most recent Mortgage that was taken out on this home.
Original Mortgage
$50,000
Interest Rate
6.58%
Mortgage Type
Stand Alone Second
Create a Home Valuation Report for This Property
The Home Valuation Report is an in-depth analysis detailing your home's value as well as a comparison with similar homes in the area
Home Values in the Area
Average Home Value in this Area
Purchase History
| Date | Buyer | Sale Price | Title Company |
|---|---|---|---|
| Burkett Beau | -- | None Available | |
| Hardisty Thomas E | -- | None Available |
Source: Public Records
Mortgage History
| Date | Status | Borrower | Loan Amount |
|---|---|---|---|
| Open | Burkett Beau | $756,000 | |
| Previous Owner | Hardisty Thomas E | $50,000 | |
| Previous Owner | Hardisty Thomas E | $389,611 |
Source: Public Records
Tax History Compared to Growth
Tax History
| Year | Tax Paid | Tax Assessment Tax Assessment Total Assessment is a certain percentage of the fair market value that is determined by local assessors to be the total taxable value of land and additions on the property. | Land | Improvement |
|---|---|---|---|---|
| 2025 | $32,010 | $2,301,994 | $1,024,800 | $1,277,194 |
| 2024 | $32,010 | $2,290,000 | $1,024,800 | $1,265,200 |
| 2023 | $32,010 | $2,313,189 | $1,024,800 | $1,288,389 |
| 2022 | $11,684 | $738,818 | $640,500 | $98,318 |
| 2021 | $16,286 | $944,525 | $512,400 | $432,125 |
| 2020 | $12,308 | $712,241 | $448,350 | $263,891 |
| 2019 | $12,628 | $707,948 | $448,350 | $259,598 |
| 2018 | $14,122 | $784,829 | $512,400 | $272,429 |
| 2017 | $13,462 | $749,132 | $512,400 | $236,732 |
| 2016 | $13,462 | $749,132 | $512,400 | $236,732 |
| 2015 | -- | $749,132 | $512,400 | $236,732 |
| 2014 | -- | $709,759 | $512,400 | $197,359 |
Source: Public Records
Map
Nearby Homes
- 306 Bluebird Cir
- 507 Flamingo Cir
- 109 Flamingo Cir
- 106 Flamingo Cir
- 1833 Highland Dr
- 207 Flamingo Cir
- 1013 Highland Dr
- 201 W Heron Dr
- 106 W Heron Dr
- 307 E Pheasant Dr
- 710 Highland Dr
- 310 Castlehigh Dr
- 109 Channel Dr
- 115 Channel Dr
- 107 Channel Dr
- 214 Mallard Point
- Lot 119 Channel Dr
- 411 W Greenbriar Dr
- 212 Bluebird Cir
- 214 Bluebird Cir
- 210 Bluebird Cir
- 214 Bluebird Cir
- 206 Bluebird Cir
- 218 Bluebird Cir
- 224 Bluebird Cir
- 202 Bluebird Cir
- 216 Bluebird Cir
- 205 Bluebird Cir
- 300 Bluebird Cir
- 200 Bluebird Cir
- 220 Bluebird Cir
- 10A Bluebird Ln
- 103 Bluebird Ln
- 184 Bluebird Cir Unit 216 Blubird Circle
- 201 Bluebird Cir
- 308 Bluebird Cir
- 309 Bluebird Cir