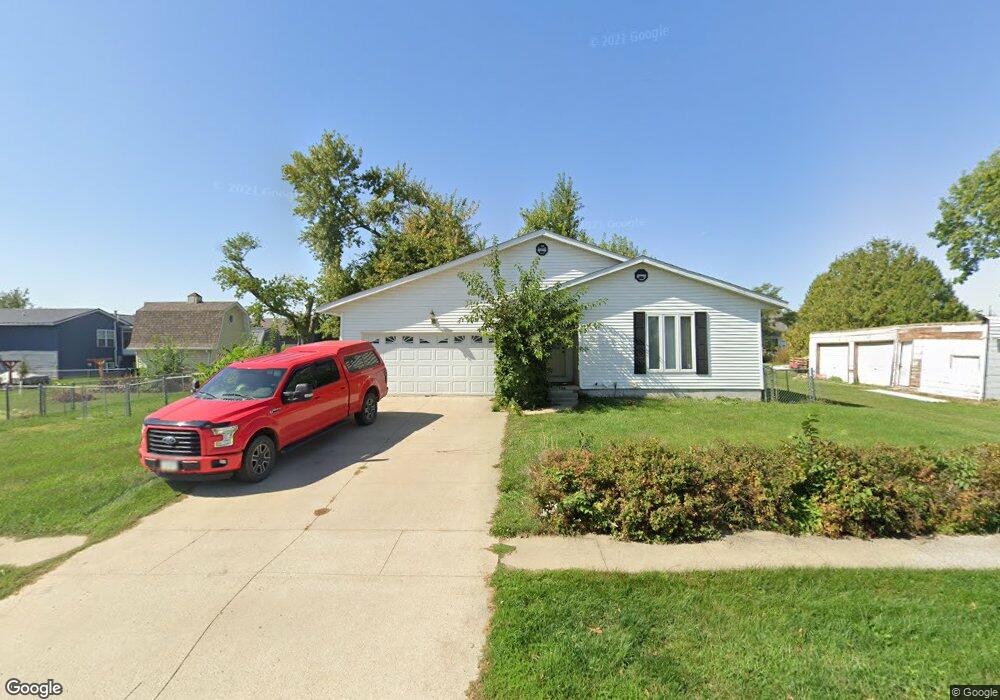
212 Canton St SW Shellsburg, IA 52332
Estimated Value: $243,996 - $261,000
3
Beds
2
Baths
2,052
Sq Ft
$123/Sq Ft
Est. Value
About This Home
This home is located at 212 Canton St SW, Shellsburg, IA 52332 and is currently estimated at $252,749, approximately $123 per square foot. 212 Canton St SW is a home located in Benton County with nearby schools including Shellsburg Elementary School, Tilford Elementary School, and Vinton-Shellsburg Middle School.
Ownership History
Date
Name
Owned For
Owner Type
Purchase Details
Closed on
Jul 3, 2006
Sold by
Gardemann Louis C and Gardemann Juanita D
Bought by
Hammond Charles and Hammond Traci
Current Estimated Value
Purchase Details
Closed on
Apr 28, 2006
Sold by
Osborn Joshua B and Osborn Nicole M
Bought by
Hammond Charles S and Hammond Traci A
Home Financials for this Owner
Home Financials are based on the most recent Mortgage that was taken out on this home.
Original Mortgage
$116,000
Interest Rate
6.37%
Mortgage Type
New Conventional
Purchase Details
Closed on
Aug 18, 2005
Sold by
Homecomings Finance Network Inc
Bought by
Osborn Joshua B
Home Financials for this Owner
Home Financials are based on the most recent Mortgage that was taken out on this home.
Original Mortgage
$73,760
Interest Rate
5.69%
Mortgage Type
Future Advance Clause Open End Mortgage
Create a Home Valuation Report for This Property
The Home Valuation Report is an in-depth analysis detailing your home's value as well as a comparison with similar homes in the area
Home Values in the Area
Average Home Value in this Area
Purchase History
| Date | Buyer | Sale Price | Title Company |
|---|---|---|---|
| Hammond Charles | $4,000 | None Available | |
| Hammond Charles S | $145,000 | None Available | |
| Osborn Joshua B | $46,000 | None Available |
Source: Public Records
Mortgage History
| Date | Status | Borrower | Loan Amount |
|---|---|---|---|
| Previous Owner | Hammond Charles S | $116,000 | |
| Previous Owner | Osborn Joshua B | $73,760 |
Source: Public Records
Tax History Compared to Growth
Tax History
| Year | Tax Paid | Tax Assessment Tax Assessment Total Assessment is a certain percentage of the fair market value that is determined by local assessors to be the total taxable value of land and additions on the property. | Land | Improvement |
|---|---|---|---|---|
| 2025 | $3,338 | $212,000 | $28,700 | $183,300 |
| 2024 | $3,338 | $200,700 | $28,900 | $171,800 |
| 2023 | $3,096 | $200,700 | $28,900 | $171,800 |
| 2022 | $3,056 | $164,600 | $23,100 | $141,500 |
| 2021 | $3,056 | $164,600 | $23,100 | $141,500 |
| 2020 | $3,212 | $170,500 | $14,800 | $155,700 |
| 2019 | $2,978 | $170,500 | $14,800 | $155,700 |
| 2018 | $2,864 | $158,700 | $12,500 | $146,200 |
| 2017 | $2,796 | $158,700 | $12,500 | $146,200 |
| 2016 | $2,736 | $147,700 | $12,000 | $135,700 |
| 2015 | $2,736 | $147,700 | $12,000 | $135,700 |
| 2014 | $2,950 | $158,200 | $0 | $0 |
Source: Public Records
Map
Nearby Homes
- 404 Main St NW
- 700 Sunset Blvd
- 205 Grove St NW
- 201 Grove St NW
- 301 Wildcat Ct
- 6127 32nd Ave Unit Lot 3
- 804 Fairway Dr
- 105 Meadow Dr
- 103 Meadow Dr
- 101 Meadow Dr
- 6240 33rd Avenue Dr
- 0 31st Ave
- 2573 Linn Benton Rd
- 2773 Ridgeview Dr
- 810 Indigo Dr
- 737 Indigo Dr
- 818 Indigo Dr
- 819 Indigo Dr
- 827 Indigo Dr
- 803 Indigo Dr
- 303 Johnson St SW
- 301 Johnson St SW
- 105 England Ct SW
- 209 Canton St SW
- 103 England Ct SW
- 208 Canton St SW
- 213 Canton St SW
- 211 Johnson St SW
- 202 Canton St SW
- 101 England Ct SW
- 107 England Ct SW
- 201 Maxwell Dr SW
- 300 Johnson St SW
- 3 England Ct SW
- 212 Johnson St SW
- 200 Maxwell Dr SW
- 104 England Ct SW
- 207 Johnson St SW
- 106 England Ct SW
- 210 Johnson St SW