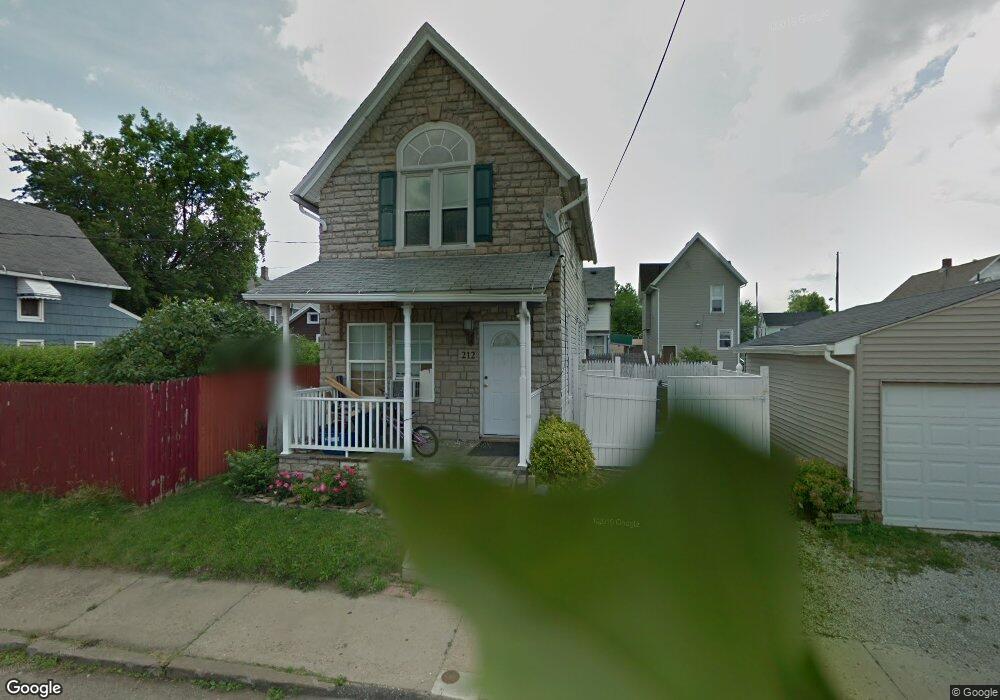
212 Collins Ct NW Canton, OH 44703
Summit NeighborhoodEstimated Value: $76,000 - $122,000
2
Beds
1
Bath
928
Sq Ft
$107/Sq Ft
Est. Value
About This Home
This home is located at 212 Collins Ct NW, Canton, OH 44703 and is currently estimated at $99,000, approximately $106 per square foot. 212 Collins Ct NW is a home located in Stark County with nearby schools including Early Learning Center @ Schreiber, Clarendon Intermediate School, and Gibbs Elementary School.
Ownership History
Date
Name
Owned For
Owner Type
Purchase Details
Closed on
Sep 18, 2023
Sold by
Stark County Land Reutilization Corporat
Bought by
City Of Canton
Current Estimated Value
Purchase Details
Closed on
Nov 6, 2017
Sold by
Showalter Franklin Scott
Bought by
Stark County Land Reutilization Corporat
Purchase Details
Closed on
Mar 21, 2005
Sold by
Hawk George A
Bought by
Showalter Franklin Scott and Showalter Shelly
Home Financials for this Owner
Home Financials are based on the most recent Mortgage that was taken out on this home.
Original Mortgage
$48,400
Interest Rate
10.27%
Mortgage Type
Purchase Money Mortgage
Purchase Details
Closed on
Dec 17, 1998
Sold by
Hawk George A and Hawk Twylla
Bought by
Hendrickson James J
Home Financials for this Owner
Home Financials are based on the most recent Mortgage that was taken out on this home.
Original Mortgage
$17,000
Interest Rate
6.96%
Mortgage Type
Seller Take Back
Purchase Details
Closed on
Aug 14, 1990
Create a Home Valuation Report for This Property
The Home Valuation Report is an in-depth analysis detailing your home's value as well as a comparison with similar homes in the area
Home Values in the Area
Average Home Value in this Area
Purchase History
| Date | Buyer | Sale Price | Title Company |
|---|---|---|---|
| City Of Canton | -- | None Listed On Document | |
| Stark County Land Reutilization Corporat | -- | None Available | |
| Showalter Franklin Scott | $48,400 | Crescent Title Agency Llc | |
| Hendrickson James J | $18,500 | -- | |
| -- | $10,000 | -- |
Source: Public Records
Mortgage History
| Date | Status | Borrower | Loan Amount |
|---|---|---|---|
| Previous Owner | Showalter Franklin Scott | $48,400 | |
| Previous Owner | Hendrickson James J | $17,000 |
Source: Public Records
Tax History Compared to Growth
Tax History
| Year | Tax Paid | Tax Assessment Tax Assessment Total Assessment is a certain percentage of the fair market value that is determined by local assessors to be the total taxable value of land and additions on the property. | Land | Improvement |
|---|---|---|---|---|
| 2025 | -- | $810 | $810 | -- |
| 2024 | -- | $810 | $810 | -- |
| 2023 | $0 | $460 | $460 | $0 |
| 2022 | $354 | $460 | $460 | $0 |
| 2021 | $354 | $460 | $460 | $0 |
| 2020 | -- | $490 | $490 | $0 |
| 2019 | $167 | $5,750 | $950 | $4,800 |
| 2018 | $337 | $5,750 | $950 | $4,800 |
| 2017 | $337 | $5,710 | $1,050 | $4,660 |
| 2016 | $5,436 | $5,250 | $1,050 | $4,200 |
| 2015 | $336 | $5,250 | $1,050 | $4,200 |
| 2014 | $839 | $6,340 | $1,260 | $5,080 |
| 2013 | $211 | $6,340 | $1,260 | $5,080 |
Source: Public Records
Map
Nearby Homes
- 1111 2nd St NW
- 413 Newton Ave NW
- 1024 3rd St NW
- 1033 Monnot Place NW
- 1015 4th St NW
- 1405 8th St NW
- 1409 8th St NW
- 435 Hazlett Ave NW
- 1221 9th St NW
- 916 6th St NW
- 202 Lincoln Ave NW
- 935 Ridge Rd NW
- 1520 11th St NW
- 201 Park Ave NW
- 1023 Fulton Rd NW
- 722 High Ave NW
- 806 Troy Place NW
- 905 High Ave NW
- 1435 12th St NW
- 646 Dueber Ave SW
- 216 Collins Ct NW
- 205 Brown Ave NW
- 207 Brown Ave NW
- 201 Brown Ave NW
- 301 Brown Ave NW
- 219 Collins Ct NW
- 999999 2nd St NW
- 200 Collins Ct NW
- 123 Brown Ave NW
- 123 Brown Ave NW Unit 1
- 1317 2nd St NW
- 223 Collins Ct NW
- 223 Collins Ct NW
- 305 Brown Ave NW
- 119 Brown Ave NW
- 309 Brown Ave NW
- 125 Brown Ave NW
- 1315 4th St NW
- 1321 4th St NW
- 1313 4th St NW