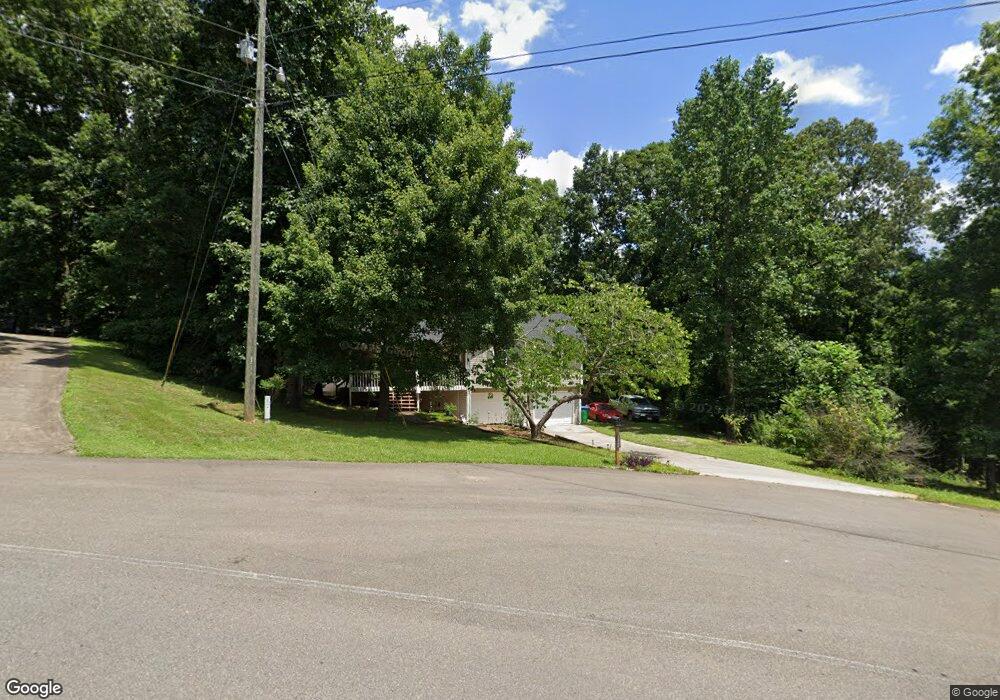
212 Deer Run Jasper, GA 30143
Estimated Value: $269,843 - $313,000
Studio
2
Baths
1,261
Sq Ft
$236/Sq Ft
Est. Value
About This Home
This home is located at 212 Deer Run, Jasper, GA 30143 and is currently estimated at $297,961, approximately $236 per square foot. 212 Deer Run is a home located in Pickens County with nearby schools including Hill City Elementary School, Pickens County Middle School, and Pickens County High School.
Ownership History
Date
Name
Owned For
Owner Type
Purchase Details
Closed on
Oct 27, 2011
Sold by
Gray Family Homes
Bought by
Gray Tommy C
Current Estimated Value
Purchase Details
Closed on
May 9, 2005
Sold by
Gray Tommy C
Bought by
Gray Fam Homes
Home Financials for this Owner
Home Financials are based on the most recent Mortgage that was taken out on this home.
Original Mortgage
$93,600
Interest Rate
5.88%
Mortgage Type
New Conventional
Purchase Details
Closed on
Aug 19, 2002
Sold by
Turner Kenneth J and Turner A
Bought by
Wiltz Daniel
Purchase Details
Closed on
Apr 2, 2002
Sold by
Gray Family Homes Llc
Bought by
First Horizon Home Loan Corp
Purchase Details
Closed on
Sep 30, 1998
Sold by
Kelley Ivan Leroy
Bought by
Turner Kenneth J and Turner A
Purchase Details
Closed on
Mar 31, 1998
Bought by
Kelley Ivan Leroy
Create a Home Valuation Report for This Property
The Home Valuation Report is an in-depth analysis detailing your home's value as well as a comparison with similar homes in the area
Home Values in the Area
Average Home Value in this Area
Purchase History
| Date | Buyer | Sale Price | Title Company |
|---|---|---|---|
| Gray Tommy C | -- | -- | |
| Gray Fam Homes | -- | -- | |
| Gray Tommy C | $117,000 | -- | |
| Wiltz Daniel | $106,500 | -- | |
| First Horizon Home Loan Corp | -- | -- | |
| Turner Kenneth J | $92,000 | -- | |
| Kelley Ivan Leroy | $13,500 | -- |
Source: Public Records
Mortgage History
| Date | Status | Borrower | Loan Amount |
|---|---|---|---|
| Previous Owner | Gray Tommy C | $93,600 |
Source: Public Records
Tax History
| Year | Tax Paid | Tax Assessment Tax Assessment Total Assessment is a certain percentage of the fair market value that is determined by local assessors to be the total taxable value of land and additions on the property. | Land | Improvement |
|---|---|---|---|---|
| 2025 | $1,614 | $89,120 | $16,000 | $73,120 |
| 2024 | $1,761 | $88,977 | $16,000 | $72,977 |
| 2023 | $1,810 | $88,977 | $16,000 | $72,977 |
| 2022 | $1,810 | $88,977 | $16,000 | $72,977 |
| 2021 | $1,172 | $53,782 | $10,000 | $43,782 |
| 2020 | $1,207 | $53,782 | $10,000 | $43,782 |
| 2019 | $1,235 | $53,782 | $10,000 | $43,782 |
| 2018 | $1,246 | $53,782 | $10,000 | $43,782 |
| 2017 | $1,267 | $53,782 | $10,000 | $43,782 |
| 2016 | $1,287 | $53,782 | $10,000 | $43,782 |
| 2015 | $953 | $40,754 | $10,000 | $30,754 |
| 2014 | $954 | $40,754 | $10,000 | $30,754 |
| 2013 | -- | $47,267 | $10,000 | $37,267 |
Source: Public Records
Map
Nearby Homes
- 244 Deer Run
- 101 Deer Run
- 240 Mill Pond Ct
- 192 Mill Pond Ct
- 2 Village Ridge
- 50 Mill Pond Ct
- 003 Hobson Rd
- 004 Hobson Rd
- 198 Whispering Waters Dr
- 361 Village Creek Dr
- 241 Village Creek Dr
- 127 Village Creek Dr
- 56 Village Creek Dr
- 149 Hidden Creek Rd
- 0 Hill City Rd Unit 7733617
- 0 Hill City Rd Unit 7600458
- 0 Hill City Rd Unit 10547283
- 1045 Pleasant Hill Rd
- 0 Hidden Creek Rd Unit 7737024
- 0 Hidden Creek Rd Unit 10712811
Your Personal Tour Guide
Ask me questions while you tour the home.