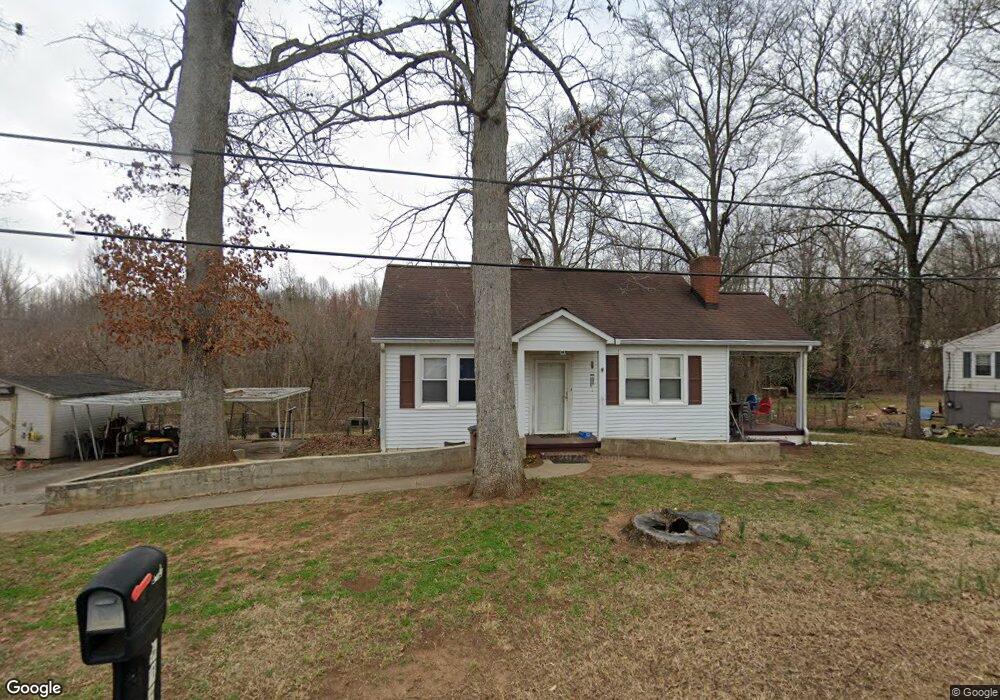
212 Dellinger Rd Shelby, NC 28152
Estimated Value: $165,269 - $230,000
--
Bed
--
Bath
1,408
Sq Ft
$146/Sq Ft
Est. Value
About This Home
This home is located at 212 Dellinger Rd, Shelby, NC 28152 and is currently estimated at $205,317, approximately $145 per square foot. 212 Dellinger Rd is a home located in Cleveland County with nearby schools including James Love Elementary School, Shelby Middle School, and Shelby High School.
Create a Home Valuation Report for This Property
The Home Valuation Report is an in-depth analysis detailing your home's value as well as a comparison with similar homes in the area
Home Values in the Area
Average Home Value in this Area
Tax History Compared to Growth
Tax History
| Year | Tax Paid | Tax Assessment Tax Assessment Total Assessment is a certain percentage of the fair market value that is determined by local assessors to be the total taxable value of land and additions on the property. | Land | Improvement |
|---|---|---|---|---|
| 2025 | $1,135 | $114,043 | $21,598 | $92,445 |
| 2024 | $1,095 | $88,806 | $17,278 | $71,528 |
| 2023 | $1,090 | $88,806 | $17,278 | $71,528 |
| 2022 | $1,090 | $88,806 | $17,278 | $71,528 |
| 2021 | $1,095 | $88,806 | $17,278 | $71,528 |
| 2020 | $997 | $78,451 | $17,278 | $61,173 |
| 2019 | $997 | $78,451 | $17,278 | $61,173 |
| 2018 | $996 | $78,451 | $17,278 | $61,173 |
| 2017 | $971 | $78,451 | $17,278 | $61,173 |
| 2016 | $974 | $78,451 | $17,278 | $61,173 |
| 2015 | $1,029 | $87,466 | $16,970 | $70,496 |
| 2014 | $1,029 | $87,466 | $16,970 | $70,496 |
Source: Public Records
Map
Nearby Homes
- 1511 Farm Rd
- 1401 Woodman Hall St
- 607 Blythe St
- 1241 S Lafayette St
- 111 Morton St
- 901 Linney Ln
- 905a Linney Ln
- 900 Linney Ln
- 712 Maynard St
- 1104 Silver St
- 1205 S Lafayette St
- 1201 S Lafayette St
- 108 Shull St
- 112 Holly Hill Rd
- 1008 Wilmouth St
- 219 Alden Ct
- 308 James Love School Rd
- 800 Charles Rd
- 804 Broad St
- 809 Howard St
- 118 Dellinger Rd
- 216 Dellinger Rd
- 213 Dellinger Rd
- 211 Dellinger Rd
- 215 Dellinger Rd
- 220 Dellinger Rd
- 209 Dellinger Rd
- 221 Dellinger Rd
- 115 Dellinger Rd
- 116 Dellinger Rd
- 111 Dellinger Rd
- 113 Dellinger Rd
- 308 Dellinger Rd
- 109 Dellinger Rd
- 112 Dellinger Rd
- 307 Dellinger Rd
- 310 Dellinger Rd
- 313 Dellinger Rd
- 103 Dellinger Rd
- 1421 Southridge St