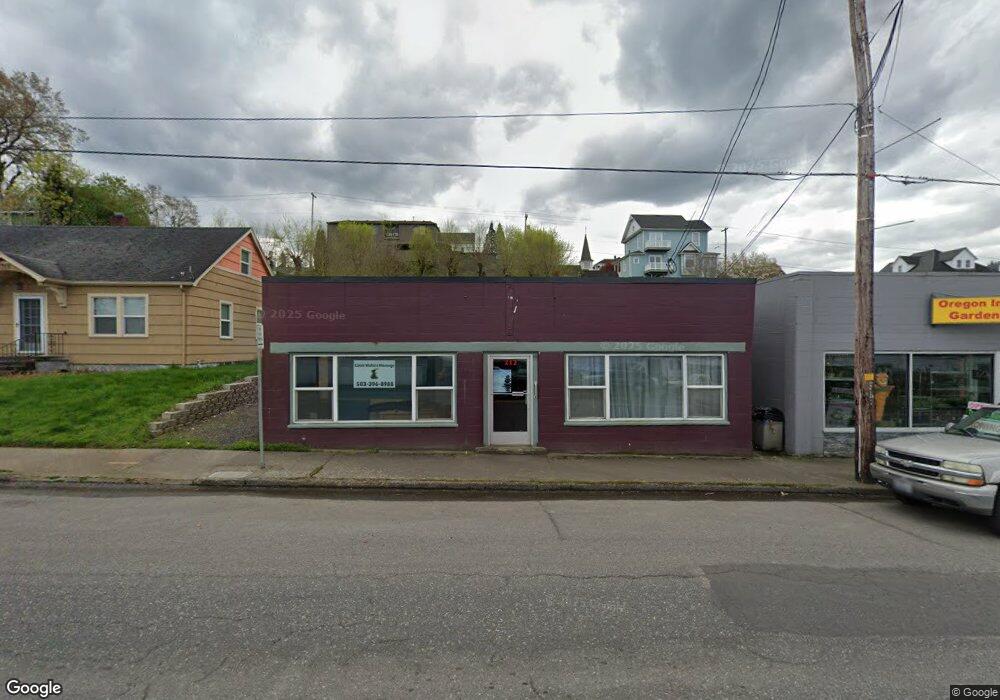
212 E B St Rainier, OR 97048
Estimated Value: $131,807
Studio
--
Bath
856
Sq Ft
$154/Sq Ft
Est. Value
About This Home
This home is located at 212 E B St, Rainier, OR 97048 and is currently estimated at $131,807, approximately $153 per square foot. 212 E B St is a home located in Columbia County with nearby schools including Hudson Park Elementary School, Rainier Junior/Senior High School, and North Columbia Academy.
Ownership History
Date
Name
Owned For
Owner Type
Purchase Details
Closed on
Apr 13, 2023
Sold by
Kohlhoff Michael E
Bought by
Fairless Trevor L and Fairless Teresa L
Current Estimated Value
Home Financials for this Owner
Home Financials are based on the most recent Mortgage that was taken out on this home.
Original Mortgage
$94,500
Outstanding Balance
$75,732
Interest Rate
6.65%
Mortgage Type
New Conventional
Estimated Equity
$56,075
Purchase Details
Closed on
Aug 1, 2005
Sold by
Leno Daniel R and Leno Josephine A
Bought by
Kohlhoff Michael E
Create a Home Valuation Report for This Property
The Home Valuation Report is an in-depth analysis detailing your home's value as well as a comparison with similar homes in the area
Purchase History
| Date | Buyer | Sale Price | Title Company |
|---|---|---|---|
| Fairless Trevor L | $126,249 | Ticor Title | |
| Kohlhoff Michael E | $65,000 | Ticor Title Insurance Co |
Source: Public Records
Mortgage History
| Date | Status | Borrower | Loan Amount |
|---|---|---|---|
| Open | Fairless Trevor L | $94,500 |
Source: Public Records
Tax History
| Year | Tax Paid | Tax Assessment Tax Assessment Total Assessment is a certain percentage of the fair market value that is determined by local assessors to be the total taxable value of land and additions on the property. | Land | Improvement |
|---|---|---|---|---|
| 2025 | $1,121 | $60,690 | $53,560 | $7,130 |
| 2024 | $1,095 | $58,930 | $52,010 | $6,920 |
| 2023 | $1,080 | $57,220 | $50,500 | $6,720 |
| 2022 | $1,031 | $55,560 | $49,040 | $6,520 |
| 2021 | $1,014 | $53,950 | $49,060 | $4,890 |
| 2020 | $986 | $52,380 | $31,100 | $21,280 |
| 2019 | $970 | $50,860 | $30,830 | $20,030 |
| 2018 | $948 | $49,380 | $27,740 | $21,640 |
| 2017 | $939 | $47,950 | $26,940 | $21,010 |
| 2016 | $913 | $46,560 | $26,170 | $20,390 |
| 2015 | $881 | $45,210 | $25,420 | $19,790 |
| 2014 | $854 | $43,900 | $29,990 | $13,910 |
Source: Public Records
Map
Nearby Homes
Your Personal Tour Guide
Ask me questions while you tour the home.