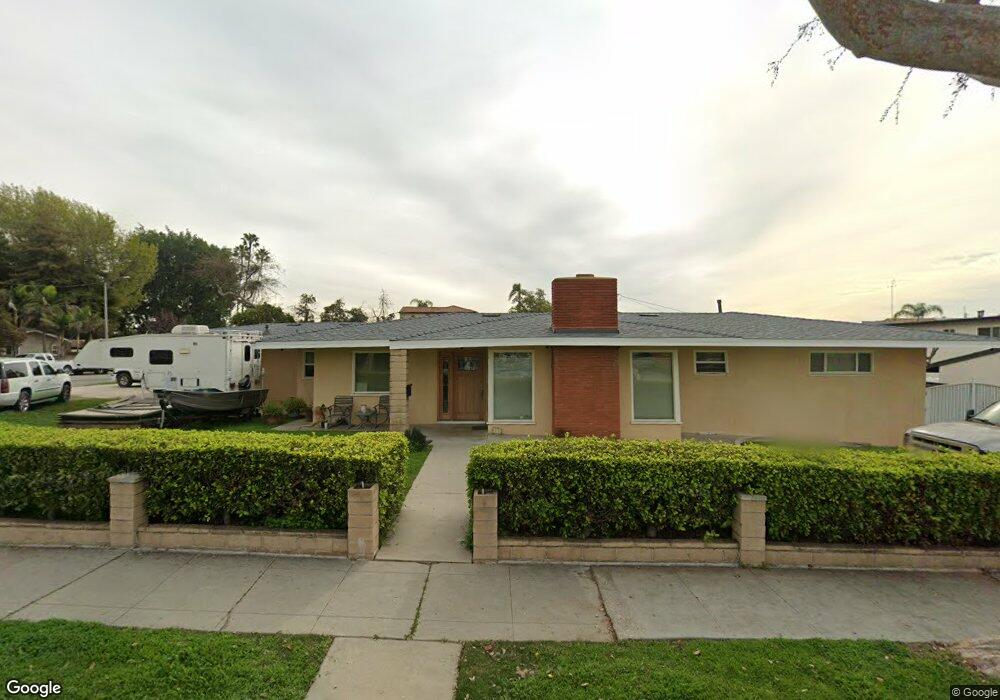
212 E Florence Ave La Habra, CA 90631
Estimated Value: $946,000 - $1,130,625
3
Beds
2
Baths
2,139
Sq Ft
$491/Sq Ft
Est. Value
About This Home
This home is located at 212 E Florence Ave, La Habra, CA 90631 and is currently estimated at $1,049,656, approximately $490 per square foot. 212 E Florence Ave is a home located in Orange County with nearby schools including El Cerrito Elementary School, Arbolita Elementary School, and Washington Middle School.
Ownership History
Date
Name
Owned For
Owner Type
Purchase Details
Closed on
Oct 22, 2004
Sold by
Grigsby Michael A
Bought by
Grigsby Michael A and Grigsby Robin Y
Current Estimated Value
Home Financials for this Owner
Home Financials are based on the most recent Mortgage that was taken out on this home.
Original Mortgage
$210,000
Outstanding Balance
$103,514
Interest Rate
5.7%
Mortgage Type
New Conventional
Estimated Equity
$946,142
Purchase Details
Closed on
Dec 14, 2000
Sold by
Grigsby Robert S and Grigsby Amy
Bought by
Grigsby Michael A
Purchase Details
Closed on
Oct 13, 1998
Sold by
Lay Mark B and Lay Christine A
Bought by
Grigsby Michael A and Grigsby Robert S
Home Financials for this Owner
Home Financials are based on the most recent Mortgage that was taken out on this home.
Original Mortgage
$153,600
Interest Rate
6.42%
Create a Home Valuation Report for This Property
The Home Valuation Report is an in-depth analysis detailing your home's value as well as a comparison with similar homes in the area
Home Values in the Area
Average Home Value in this Area
Purchase History
| Date | Buyer | Sale Price | Title Company |
|---|---|---|---|
| Grigsby Michael A | -- | Ticor Title Company | |
| Grigsby Michael A | -- | North American Title Co | |
| Grigsby Michael A | $192,000 | North American Title |
Source: Public Records
Mortgage History
| Date | Status | Borrower | Loan Amount |
|---|---|---|---|
| Open | Grigsby Michael A | $210,000 | |
| Closed | Grigsby Michael A | $153,600 |
Source: Public Records
Tax History Compared to Growth
Tax History
| Year | Tax Paid | Tax Assessment Tax Assessment Total Assessment is a certain percentage of the fair market value that is determined by local assessors to be the total taxable value of land and additions on the property. | Land | Improvement |
|---|---|---|---|---|
| 2025 | $3,521 | $300,945 | $167,343 | $133,602 |
| 2024 | $3,521 | $295,045 | $164,062 | $130,983 |
| 2023 | $3,437 | $289,260 | $160,845 | $128,415 |
| 2022 | $3,398 | $283,589 | $157,691 | $125,898 |
| 2021 | $3,342 | $278,029 | $154,599 | $123,430 |
| 2020 | $3,309 | $275,179 | $153,014 | $122,165 |
| 2019 | $3,220 | $269,784 | $150,014 | $119,770 |
| 2018 | $3,165 | $264,495 | $147,073 | $117,422 |
| 2017 | $3,108 | $259,309 | $144,189 | $115,120 |
| 2016 | $3,035 | $254,225 | $141,362 | $112,863 |
| 2015 | $2,949 | $250,407 | $139,239 | $111,168 |
| 2014 | $2,861 | $245,502 | $136,511 | $108,991 |
Source: Public Records
Map
Nearby Homes
- 313 W 1st Ave Unit M
- 760 N Orange St
- 762 N Orange St
- 304 E Whittier Blvd
- 764 N Orange St
- 766 N Orange St
- Plan 4 - The Sage at The Birchwoods
- Plan 2 - The Poppy at The Birchwoods
- 332 E Whittier Blvd
- 770 N Orange St
- 303 S Cadiz Ct
- 320 E Whittier Blvd
- 570 E 2nd Ave
- 581 W Greenwood Ave Unit 6
- 994 E La Habra Blvd Unit 246
- 211 W Mountain View Ave
- 720 W La Habra Blvd
- 950 N Walnut St
- 308 S Valencia St
- 501 Willow St
- 221 N Orange St
- 200 E Florence Ave
- 222 N Main St
- 304 E Florence Ave
- 219 N Orange St
- 218 N Main St
- 215 E Florence Ave
- 306 E Florence Ave
- 219 E Florence Ave
- 211 E Florence Ave
- 203 E Florence Ave
- 301 E Florence Ave
- 310 E Florence Ave
- 201 E Florence Ave
- 305 E Florence Ave
- 139 E Florence Ave
- 314 E Florence Ave
- 220 E Francis Ave
- 230 E Francis Ave
- 151 Fuerte Ln