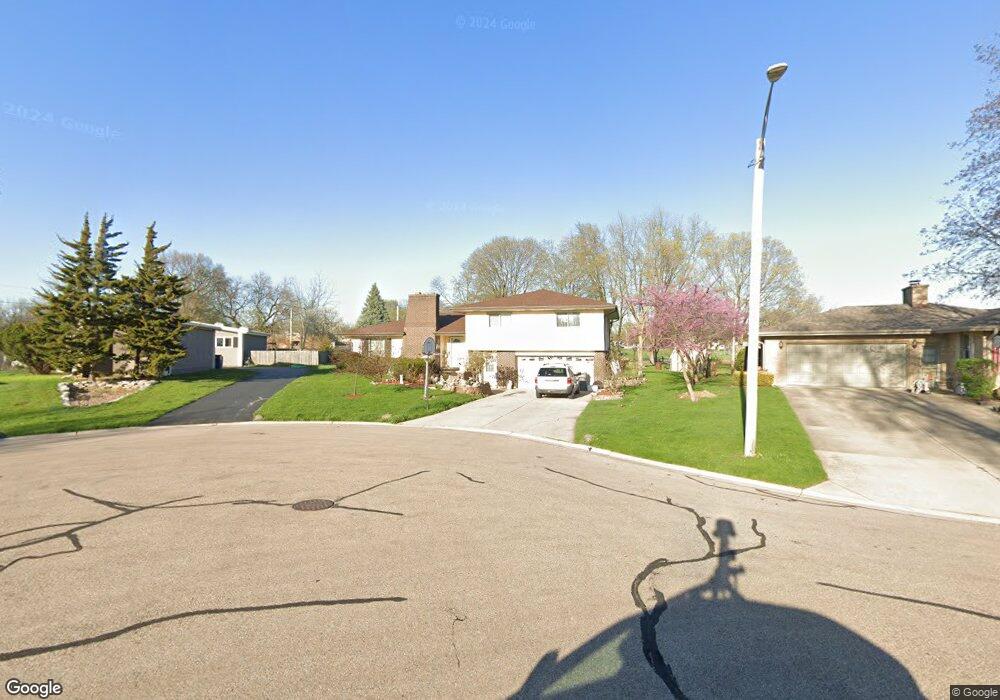
212 Hartway Ct Montgomery, IL 60538
Estimated Value: $317,000 - $388,000
4
Beds
3
Baths
2,336
Sq Ft
$152/Sq Ft
Est. Value
About This Home
This home is located at 212 Hartway Ct, Montgomery, IL 60538 and is currently estimated at $355,606, approximately $152 per square foot. 212 Hartway Ct is a home located in Kane County with nearby schools including R.E. Krug Elementary School, K D Waldo Middle School, and East Aurora High School.
Ownership History
Date
Name
Owned For
Owner Type
Purchase Details
Closed on
Nov 7, 2024
Sold by
Desanchez Jessika Sandra Casaya and Sanchez Jessika S
Bought by
Desanchez Jessika Sandra Casay
Current Estimated Value
Purchase Details
Closed on
Oct 23, 2024
Sold by
Desanchez Jessika Sandra Casaya and Sanchez Jessika S
Bought by
Desanchez Jessika Sandra Casay
Purchase Details
Closed on
Feb 14, 2011
Sold by
Sanchez Jesus M
Bought by
Sanchez Jessika S and Casaya Jessika S
Purchase Details
Closed on
Jan 31, 1996
Sold by
Rouse Kevin L and Rouse Susan F
Bought by
Sanchez Jesus M and Sanchez Jessika S
Home Financials for this Owner
Home Financials are based on the most recent Mortgage that was taken out on this home.
Original Mortgage
$115,951
Interest Rate
7.07%
Mortgage Type
FHA
Create a Home Valuation Report for This Property
The Home Valuation Report is an in-depth analysis detailing your home's value as well as a comparison with similar homes in the area
Home Values in the Area
Average Home Value in this Area
Purchase History
| Date | Buyer | Sale Price | Title Company |
|---|---|---|---|
| Desanchez Jessika Sandra Casay | -- | None Listed On Document | |
| Desanchez Jessika Sandra Casay | -- | None Listed On Document | |
| Sanchez Jessika S | -- | None Available | |
| Sanchez Jesus M | $117,000 | Attorneys National Title |
Source: Public Records
Mortgage History
| Date | Status | Borrower | Loan Amount |
|---|---|---|---|
| Previous Owner | Sanchez Jesus M | $115,951 |
Source: Public Records
Tax History Compared to Growth
Tax History
| Year | Tax Paid | Tax Assessment Tax Assessment Total Assessment is a certain percentage of the fair market value that is determined by local assessors to be the total taxable value of land and additions on the property. | Land | Improvement |
|---|---|---|---|---|
| 2024 | $5,105 | $99,303 | $15,776 | $83,527 |
| 2023 | $4,864 | $88,727 | $14,096 | $74,631 |
| 2022 | $4,755 | $80,955 | $12,861 | $68,094 |
| 2021 | $4,655 | $75,370 | $11,974 | $63,396 |
| 2020 | $4,995 | $78,113 | $11,122 | $66,991 |
| 2019 | $4,897 | $72,374 | $10,305 | $62,069 |
| 2018 | $4,931 | $70,245 | $9,532 | $60,713 |
| 2017 | $4,752 | $63,739 | $8,783 | $54,956 |
| 2016 | $4,797 | $60,216 | $8,858 | $51,358 |
| 2015 | -- | $52,468 | $7,617 | $44,851 |
| 2014 | -- | $50,463 | $7,326 | $43,137 |
| 2013 | -- | $48,271 | $8,253 | $40,018 |
Source: Public Records
Map
Nearby Homes
- 1342 Oak Ridge Ln
- 1336 Douglas Ave Unit 13
- 170 Montgomery Rd
- Lot 1 Douglas Ave
- 1422 Manning Ave
- 1440 Manning Ave
- 1375 Manning Ave
- 1405 Manning Ave
- 0 N River St
- 1707 Deer Run Dr
- 962 Oliver Ave
- 1022 Sard Ave
- 106 Hamlet Cir
- 735 Sexton St
- 847 Oliver Ave
- 820 Oliver Ave
- 815 Oliver Ave
- 421 Simms St
- 713 S 4th St
- 37 Fallcreek Cir
- 210 Hartway Ct
- 214 Hartway Ct
- 208 Hartway Ct
- 216 Hartway Ct
- 207 Hartway Dr
- 206 Hartway Ct
- 207 Hartway Ct
- 218 Hartway Ct
- 211 Hartway Ct
- 204 Hartway Ct
- 205 Hartway Ct
- 213 Hartway Ct
- 202 Hartway Ct
- 222 Hartway Ct
- 215 Hartway Ct
- 1150 S Lincoln Ave
- 217 Hartway Ct
- 1220 S Lincoln Ave Unit 22
- 1224 S Lincoln Ave
- 224 Hartway Ct