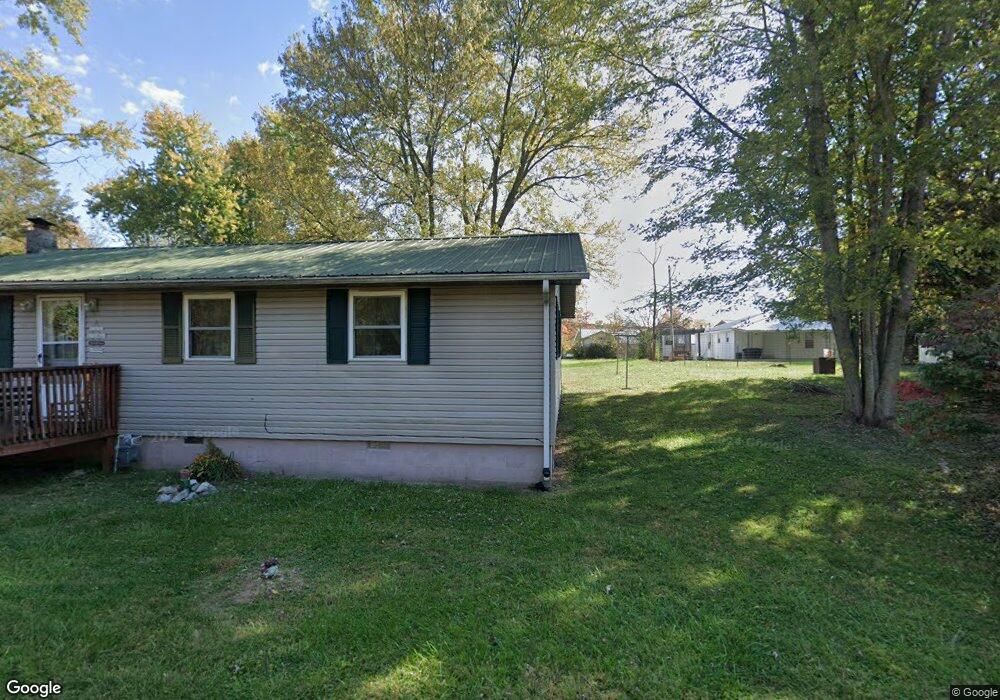
212 Hull St Jamestown, TN 38556
Estimated Value: $120,211 - $177,000
--
Bed
1
Bath
1,404
Sq Ft
$112/Sq Ft
Est. Value
About This Home
This home is located at 212 Hull St, Jamestown, TN 38556 and is currently estimated at $156,553, approximately $111 per square foot. 212 Hull St is a home located in Fentress County with nearby schools including Cumberland Christian School.
Ownership History
Date
Name
Owned For
Owner Type
Purchase Details
Closed on
Jan 14, 2013
Sold by
Peters Thomas
Bought by
Peters Allen
Current Estimated Value
Purchase Details
Closed on
Sep 18, 2008
Bought by
Peters Thomas and Peters Claudine
Home Financials for this Owner
Home Financials are based on the most recent Mortgage that was taken out on this home.
Original Mortgage
$30,000
Interest Rate
6.49%
Mortgage Type
Cash
Purchase Details
Closed on
Oct 11, 2001
Bought by
Peters Allen
Purchase Details
Closed on
May 24, 1988
Bought by
Peters Thomas and Peters Claudine
Create a Home Valuation Report for This Property
The Home Valuation Report is an in-depth analysis detailing your home's value as well as a comparison with similar homes in the area
Home Values in the Area
Average Home Value in this Area
Purchase History
| Date | Buyer | Sale Price | Title Company |
|---|---|---|---|
| Peters Allen | -- | -- | |
| Peters Thomas | $17,400 | -- | |
| Peters Allen | $10,000 | -- | |
| Peters Thomas | $24,900 | -- |
Source: Public Records
Mortgage History
| Date | Status | Borrower | Loan Amount |
|---|---|---|---|
| Previous Owner | Peters Thomas | $30,000 |
Source: Public Records
Tax History Compared to Growth
Tax History
| Year | Tax Paid | Tax Assessment Tax Assessment Total Assessment is a certain percentage of the fair market value that is determined by local assessors to be the total taxable value of land and additions on the property. | Land | Improvement |
|---|---|---|---|---|
| 2025 | -- | $26,900 | $0 | $0 |
| 2024 | -- | $26,900 | $3,625 | $23,275 |
| 2023 | $456 | $26,650 | $3,375 | $23,275 |
| 2022 | $352 | $13,400 | $2,250 | $11,150 |
| 2021 | $352 | $13,400 | $2,250 | $11,150 |
| 2020 | $256 | $13,400 | $2,250 | $11,150 |
| 2019 | $352 | $13,400 | $2,250 | $11,150 |
| 2018 | $352 | $13,400 | $2,250 | $11,150 |
| 2017 | $345 | $12,775 | $2,250 | $10,525 |
| 2016 | $345 | $12,775 | $2,250 | $10,525 |
| 2015 | $346 | $12,778 | $0 | $0 |
| 2014 | $346 | $12,778 | $0 | $0 |
Source: Public Records
Map
Nearby Homes