Estimated Value: $290,161 - $371,000
4
Beds
2
Baths
1,366
Sq Ft
$240/Sq Ft
Est. Value
About This Home
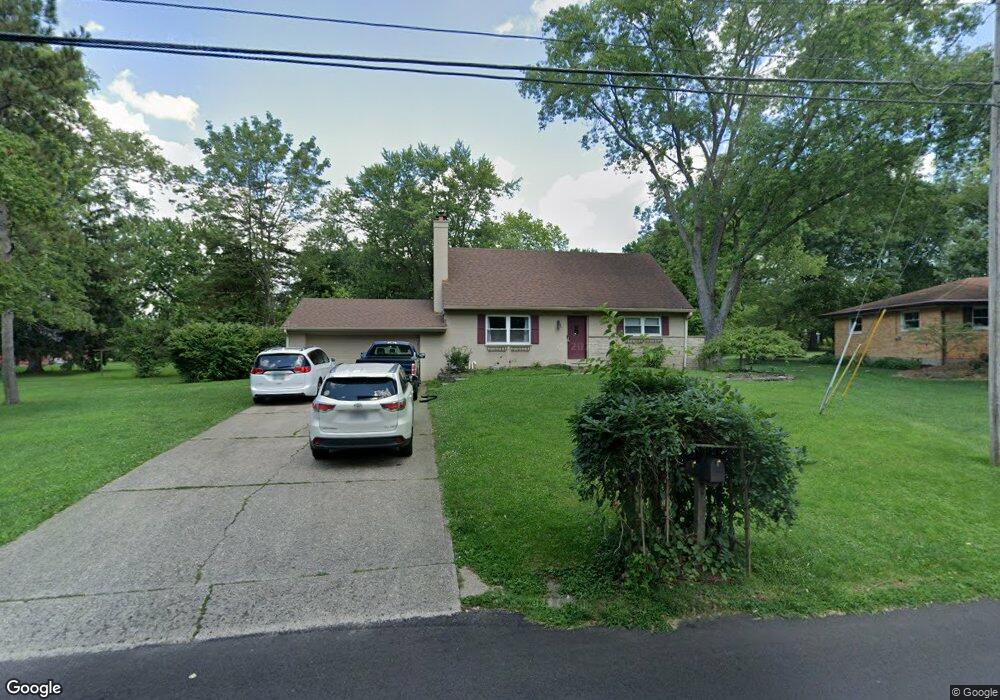
This home is located at 212 Lakeview Dr, Mason, OH 45040 and is currently estimated at $327,540, approximately $239 per square foot. 212 Lakeview Dr is a home located in Warren County with nearby schools including Mason Intermediate Elementary School, Mason Middle School, and William Mason High School.
Ownership History
Date
Name
Owned For
Owner Type
Purchase Details
Closed on
Jan 30, 2004
Sold by
Pfeffer Troy A
Bought by
Laib Gregory F and Laib Patty L
Current Estimated Value
Home Financials for this Owner
Home Financials are based on the most recent Mortgage that was taken out on this home.
Original Mortgage
$155,100
Outstanding Balance
$70,736
Interest Rate
5.88%
Mortgage Type
Purchase Money Mortgage
Estimated Equity
$256,804
Purchase Details
Closed on
Jun 20, 2003
Sold by
Pfeffer Natalie A
Bought by
Pfeffer Troy A
Purchase Details
Closed on
Feb 11, 1997
Sold by
Suess Michael J
Bought by
Pfeffer Troy A and Pfeffer Natalie A
Home Financials for this Owner
Home Financials are based on the most recent Mortgage that was taken out on this home.
Original Mortgage
$117,500
Interest Rate
7.73%
Mortgage Type
New Conventional
Purchase Details
Closed on
Aug 23, 1985
Sold by
Apke Apke and Apke Judith
Bought by
Suess Suess and Suess Michael
Purchase Details
Closed on
Jun 23, 1982
Sold by
Apke Apke and Apke William H
Create a Home Valuation Report for This Property
The Home Valuation Report is an in-depth analysis detailing your home's value as well as a comparison with similar homes in the area
Home Values in the Area
Average Home Value in this Area
Purchase History
| Date | Buyer | Sale Price | Title Company |
|---|---|---|---|
| Laib Gregory F | $159,900 | Lawyers Title | |
| Pfeffer Troy A | -- | -- | |
| Pfeffer Troy A | $127,500 | -- | |
| Suess Suess | $72,000 | -- | |
| -- | -- | -- |
Source: Public Records
Mortgage History
| Date | Status | Borrower | Loan Amount |
|---|---|---|---|
| Open | Laib Gregory F | $155,100 | |
| Previous Owner | Pfeffer Troy A | $117,500 |
Source: Public Records
Tax History
| Year | Tax Paid | Tax Assessment Tax Assessment Total Assessment is a certain percentage of the fair market value that is determined by local assessors to be the total taxable value of land and additions on the property. | Land | Improvement |
|---|---|---|---|---|
| 2025 | $3,349 | $82,510 | $24,500 | $58,010 |
| 2024 | $3,349 | $82,510 | $24,500 | $58,010 |
| 2023 | $3,190 | $66,405 | $15,067 | $51,338 |
| 2022 | $3,149 | $66,406 | $15,068 | $51,338 |
| 2021 | $2,983 | $66,406 | $15,068 | $51,338 |
| 2020 | $2,829 | $53,988 | $12,250 | $41,738 |
| 2019 | $2,600 | $53,988 | $12,250 | $41,738 |
| 2018 | $2,609 | $53,988 | $12,250 | $41,738 |
| 2017 | $2,531 | $48,895 | $11,267 | $37,629 |
| 2016 | $2,607 | $48,895 | $11,267 | $37,629 |
| 2015 | $2,613 | $48,895 | $11,267 | $37,629 |
| 2014 | $2,547 | $44,450 | $10,240 | $34,210 |
| 2013 | $2,553 | $53,170 | $12,250 | $40,920 |
Source: Public Records
Map
Nearby Homes
- 220 Kings Mills Rd
- 4268 Fontenay
- 4178 Marival Way
- 4279 Marival Dr
- 314 E Main St
- 306 E Main St
- 304 E Main St
- 5533 Cox-Smith Rd
- 5523 Cox-Smith Rd
- 5513 Cox-Smith Rd
- 107 Cowan Dr
- 5399 Country Ridge Dr
- 4253 Spyglass Hill Unit 4253
- 5503 Cox-Smith Rd
- 5493 Cox-Smith Rd
- 5921 Fairway Dr
- 4163 Spyglass Hill Unit 4163
- 382 Walnut Ln
- 5276 Bay Pointe Dr
- 618 Bunker Ln
- 210 Lakeview Dr
- 203 Northcrest Dr
- 205 Northcrest Dr
- 201 Northcrest Dr
- 208 Lakeview Dr
- 121 Lynnview Dr
- 119 Lynnview Dr
- 123 Lynnview Dr
- 211 Lakeview Dr
- 187 N Shore Place
- 185 N Shore Place
- 209 Lakeview Dr
- 117 Lynnview Dr
- 125 Lynnview Dr
- 206 Lakeview Dr
- L Northcrest Dr
- 207 Lakeview Dr
- 213 Lakeview Dr
- 115 Lynnview Dr
- 204 Northcrest Dr
Your Personal Tour Guide
Ask me questions while you tour the home.