Estimated Value: $441,000 - $530,000
4
Beds
3
Baths
2,281
Sq Ft
$208/Sq Ft
Est. Value
About This Home
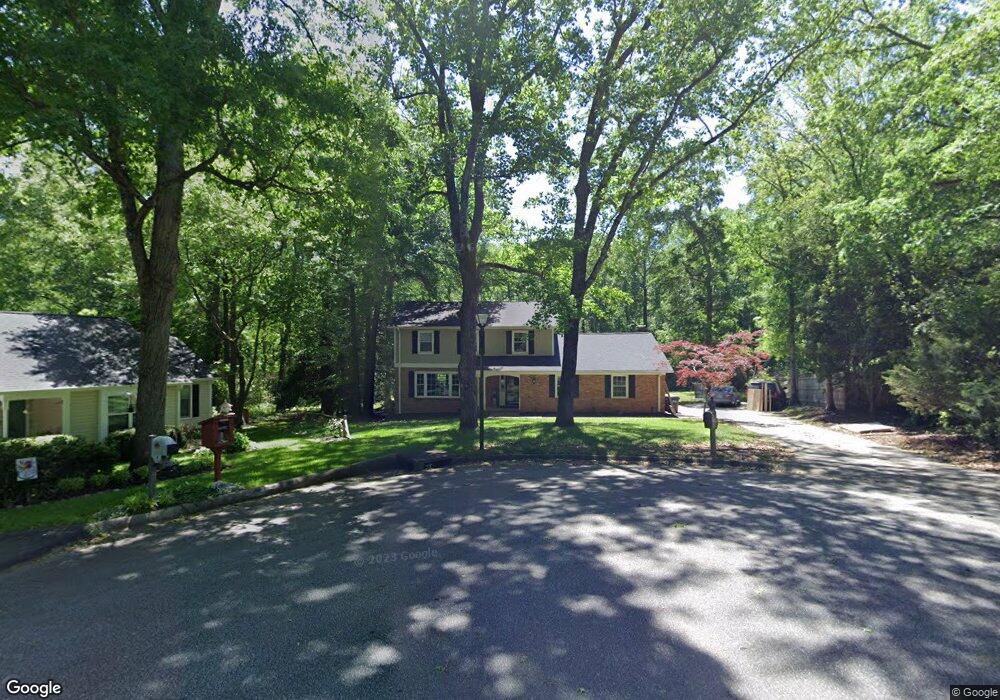
This home is located at 212 Morgan Ct, Greer, SC 29650 and is currently estimated at $474,335, approximately $207 per square foot. 212 Morgan Ct is a home located in Greenville County with nearby schools including Brushy Creek Elementary School, Riverside Middle School, and Riverside High School.
Ownership History
Date
Name
Owned For
Owner Type
Purchase Details
Closed on
Aug 18, 2022
Sold by
Newstyle Blaize Ridge Llc
Bought by
Newstyle Blaize Ridge Ii Llc
Current Estimated Value
Purchase Details
Closed on
Dec 4, 2015
Sold by
Warren Lori M
Bought by
Kott Lauren and Kott Jason
Home Financials for this Owner
Home Financials are based on the most recent Mortgage that was taken out on this home.
Original Mortgage
$196,377
Interest Rate
3.58%
Mortgage Type
FHA
Purchase Details
Closed on
May 29, 2012
Sold by
Warren Charles D
Bought by
Warren Lori M
Purchase Details
Closed on
Aug 31, 2007
Sold by
Pearlman Howard W
Bought by
Warren Charles D and Warren Lori M
Home Financials for this Owner
Home Financials are based on the most recent Mortgage that was taken out on this home.
Original Mortgage
$164,000
Interest Rate
6.7%
Mortgage Type
Purchase Money Mortgage
Create a Home Valuation Report for This Property
The Home Valuation Report is an in-depth analysis detailing your home's value as well as a comparison with similar homes in the area
Home Values in the Area
Average Home Value in this Area
Purchase History
| Date | Buyer | Sale Price | Title Company |
|---|---|---|---|
| Newstyle Blaize Ridge Ii Llc | $1,146,950 | None Listed On Document | |
| Kott Lauren | $20,000,000 | None Available | |
| Warren Lori M | -- | -- | |
| Warren Charles D | $205,000 | None Available |
Source: Public Records
Mortgage History
| Date | Status | Borrower | Loan Amount |
|---|---|---|---|
| Previous Owner | Kott Lauren | $196,377 | |
| Previous Owner | Warren Charles D | $164,000 |
Source: Public Records
Tax History
| Year | Tax Paid | Tax Assessment Tax Assessment Total Assessment is a certain percentage of the fair market value that is determined by local assessors to be the total taxable value of land and additions on the property. | Land | Improvement |
|---|---|---|---|---|
| 2025 | $1,421 | $9,830 | $2,880 | $6,950 |
| 2024 | $1,421 | $8,540 | $1,660 | $6,880 |
| 2023 | $1,365 | $8,540 | $1,660 | $6,880 |
| 2022 | $1,261 | $8,540 | $1,660 | $6,880 |
| 2021 | $1,261 | $8,540 | $1,660 | $6,880 |
| 2020 | $1,313 | $8,360 | $1,520 | $6,840 |
| 2019 | $1,287 | $8,360 | $1,520 | $6,840 |
| 2018 | $1,385 | $8,360 | $1,520 | $6,840 |
| 2017 | $1,373 | $8,360 | $1,520 | $6,840 |
| 2016 | $1,307 | $208,910 | $38,000 | $170,910 |
| 2015 | $1,290 | $208,910 | $38,000 | $170,910 |
| 2014 | $1,442 | $236,150 | $42,131 | $194,019 |
Source: Public Records
Map
Nearby Homes
- 9 Claymore Ct
- 8 Sunfield Ct
- 96 W Hackney Rd
- 109 Hammett Grove Ln
- 36 Riley Hill Ct
- 138 Middleby Way
- Davenport Plan at Arrowood Acres
- VAIL Plan at Arrowood Acres
- KATHRYN Plan at Arrowood Acres
- KENNEDY Plan at Arrowood Acres
- Dawson Plan at Arrowood Acres
- Forsyth Plan at Arrowood Acres
- FLEETWOOD Plan at Arrowood Acres
- HAMPSHIRE Plan at Arrowood Acres
- Inlet Plan at Arrowood Acres
- GRAYMOUNT Plan at Arrowood Acres
- 7 Crosswinds Way
- 7 Bailess Ct
- 5 Bailess Ct
- 220 Spring Crossing Cir
Your Personal Tour Guide
Ask me questions while you tour the home.