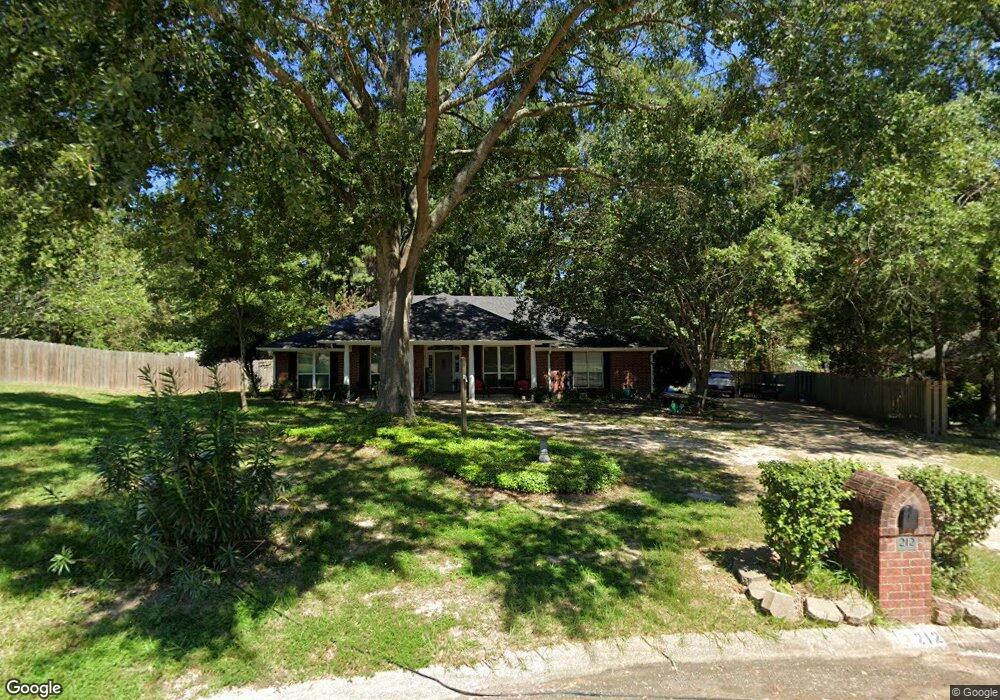
212 Paint Brush Cir Lufkin, TX 75904
Estimated Value: $251,708 - $301,000
--
Bed
10
Baths
2,132
Sq Ft
$134/Sq Ft
Est. Value
About This Home
This home is located at 212 Paint Brush Cir, Lufkin, TX 75904 and is currently estimated at $286,427, approximately $134 per square foot. 212 Paint Brush Cir is a home located in Angelina County with nearby schools including Trout Primary School, Brookhollow Elementary School, and Lufkin Middle School.
Ownership History
Date
Name
Owned For
Owner Type
Purchase Details
Closed on
Apr 22, 2015
Sold by
Reeve Ryan Kaleb and Reeve Valerie D Nell
Bought by
Bryan Wendy E
Current Estimated Value
Purchase Details
Closed on
Sep 30, 2013
Sold by
Lula Gregory and Friedman Laura
Bought by
Reeve Ryan Kaleb and Reeve Vaerie D Nell
Home Financials for this Owner
Home Financials are based on the most recent Mortgage that was taken out on this home.
Original Mortgage
$166,840
Interest Rate
4.46%
Mortgage Type
New Conventional
Purchase Details
Closed on
Feb 2, 2011
Sold by
Smith Sheldon K and Smith Elizabeth G
Bought by
Lula Gregory and Friedman Laura
Purchase Details
Closed on
Jun 24, 2005
Sold by
Wilkerson Jimmy J and Wilkerson Stephanie L
Bought by
Smith Sheldon K and Smith Elizabeth G
Home Financials for this Owner
Home Financials are based on the most recent Mortgage that was taken out on this home.
Original Mortgage
$103,500
Interest Rate
5.76%
Mortgage Type
New Conventional
Create a Home Valuation Report for This Property
The Home Valuation Report is an in-depth analysis detailing your home's value as well as a comparison with similar homes in the area
Home Values in the Area
Average Home Value in this Area
Purchase History
| Date | Buyer | Sale Price | Title Company |
|---|---|---|---|
| Bryan Wendy E | -- | Community Title | |
| Reeve Ryan Kaleb | -- | None Available | |
| Lula Gregory | -- | None Available | |
| Smith Sheldon K | $103,500 | None Available |
Source: Public Records
Mortgage History
| Date | Status | Borrower | Loan Amount |
|---|---|---|---|
| Previous Owner | Reeve Ryan Kaleb | $166,840 | |
| Previous Owner | Smith Sheldon K | $103,500 |
Source: Public Records
Tax History Compared to Growth
Tax History
| Year | Tax Paid | Tax Assessment Tax Assessment Total Assessment is a certain percentage of the fair market value that is determined by local assessors to be the total taxable value of land and additions on the property. | Land | Improvement |
|---|---|---|---|---|
| 2025 | $5,146 | $246,260 | $29,160 | $217,100 |
| 2024 | $5,108 | $244,450 | $29,160 | $215,290 |
| 2023 | $4,789 | $241,010 | $29,160 | $211,850 |
| 2022 | $5,001 | $219,560 | $29,160 | $190,400 |
| 2021 | $4,736 | $192,250 | $29,160 | $163,090 |
| 2020 | $4,725 | $192,250 | $29,160 | $163,090 |
| 2019 | $5,240 | $201,580 | $29,160 | $172,420 |
| 2018 | $4,139 | $198,010 | $29,160 | $168,850 |
| 2017 | $4,139 | $186,340 | $24,300 | $162,040 |
| 2016 | $4,380 | $183,710 | $24,300 | $159,410 |
| 2015 | $4,057 | $183,710 | $24,300 | $159,410 |
| 2014 | $4,057 | $180,840 | $24,300 | $156,540 |
Source: Public Records
Map
Nearby Homes
- 308 Paintbrush Cir
- 1409 Bending Brook Cir
- 1706 Juniper Ln
- 1504 Azalea Dr
- 1503 Blue Bonnet St
- 1904 Loblolly Ln
- 1514 Spanish Moss Dr
- 1442 Sleepy Hollow Dr
- 1442 Sleepy Hollow Dr
- 1308 Live Oak Ln
- Lot 2 Shady Elm
- Lot 1 Shady Elm
- 1308 Walnut Bend Dr
- 350 Quail Creek Dr
- 1304 Walnut Bend Dr
- 1308 Brook Hollow Dr
- 1204 Live Oak Ln
- 1400 Brookwood Place
- TBD Bending Oak St
- 107 Bending Oak St
- 212 Paintbrush Cir
- 302 Paint Brush Cir
- 302 Paintbrush Cir
- 210 Paint Brush Cir
- 210 Paintbrush Cir
- 108 Golden Rod Ct
- 304 Paint Brush Cir
- 209 Paint Brush Cir
- 1401 Bending Brook Cir
- 208 Paintbrush Cir
- 208 Paint Brush Cir
- 207 Paint Brush Cir
- 306 Paintbrush Cir
- 306 Paint Brush Cir
- 403 Paintbrush Cir
- 4 Parkway Plaza
- 106 Golden Rod Ct
- 206 Paintbrush Cir
- 206 Paint Brush Cir
- 109 Golden Rod Ct