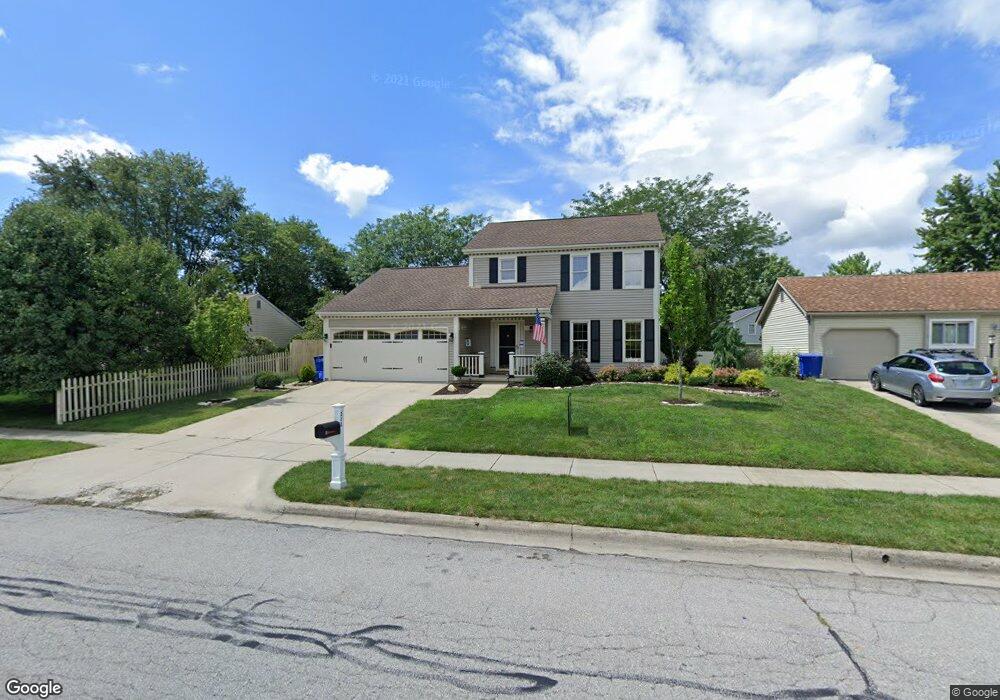
212 Rock Creek Dr Delaware, OH 43015
Estimated Value: $330,000 - $351,000
3
Beds
3
Baths
1,638
Sq Ft
$208/Sq Ft
Est. Value
About This Home
This home is located at 212 Rock Creek Dr, Delaware, OH 43015 and is currently estimated at $341,016, approximately $208 per square foot. 212 Rock Creek Dr is a home located in Delaware County with nearby schools including Robert F. Schultz Elementary School, John C. Dempsey Middle School, and Rutherford B. Hayes High School.
Ownership History
Date
Name
Owned For
Owner Type
Purchase Details
Closed on
Sep 3, 2021
Sold by
Ackerman Michael George and Ackerman Kristen Danielle
Bought by
Smiar Tristen A
Current Estimated Value
Home Financials for this Owner
Home Financials are based on the most recent Mortgage that was taken out on this home.
Original Mortgage
$244,000
Outstanding Balance
$221,690
Interest Rate
2.7%
Mortgage Type
New Conventional
Estimated Equity
$119,326
Purchase Details
Closed on
Jun 5, 2016
Sold by
Kolosky Jeffrey and Kolosky Charlene
Bought by
Ackerman Michael George and Ackerman Kristen Danielle
Home Financials for this Owner
Home Financials are based on the most recent Mortgage that was taken out on this home.
Original Mortgage
$135,920
Interest Rate
3.6%
Mortgage Type
New Conventional
Purchase Details
Closed on
Mar 1, 1987
Bought by
Kolosky Jeffrey Charlene
Create a Home Valuation Report for This Property
The Home Valuation Report is an in-depth analysis detailing your home's value as well as a comparison with similar homes in the area
Home Values in the Area
Average Home Value in this Area
Purchase History
| Date | Buyer | Sale Price | Title Company |
|---|---|---|---|
| Smiar Tristen A | $305,000 | Ohio Real Title Agency | |
| Ackerman Michael George | $169,900 | Performance Title | |
| Kolosky Jeffrey Charlene | $74,300 | -- |
Source: Public Records
Mortgage History
| Date | Status | Borrower | Loan Amount |
|---|---|---|---|
| Open | Smiar Tristen A | $244,000 | |
| Previous Owner | Ackerman Michael George | $135,920 |
Source: Public Records
Tax History Compared to Growth
Tax History
| Year | Tax Paid | Tax Assessment Tax Assessment Total Assessment is a certain percentage of the fair market value that is determined by local assessors to be the total taxable value of land and additions on the property. | Land | Improvement |
|---|---|---|---|---|
| 2024 | $4,212 | $89,220 | $21,530 | $67,690 |
| 2023 | $4,220 | $89,220 | $21,530 | $67,690 |
| 2022 | $3,785 | $69,440 | $14,700 | $54,740 |
| 2021 | $3,869 | $69,440 | $14,700 | $54,740 |
| 2020 | $3,912 | $69,440 | $14,700 | $54,740 |
| 2019 | $3,379 | $54,360 | $12,250 | $42,110 |
| 2018 | $3,426 | $54,360 | $12,250 | $42,110 |
| 2017 | $3,049 | $46,760 | $9,590 | $37,170 |
| 2016 | $2,689 | $46,760 | $9,590 | $37,170 |
| 2015 | $2,705 | $46,760 | $9,590 | $37,170 |
| 2014 | $2,748 | $46,760 | $9,590 | $37,170 |
| 2013 | $2,763 | $46,760 | $9,590 | $37,170 |
Source: Public Records
Map
Nearby Homes
- 383 Wheatfield Dr
- 431 Wheatfield Dr
- 177 Richards Dr
- 362 Hearthstone Dr
- 189 Delaware Dr
- 327 Rockmill St
- 106 Gold Dust Ct
- 231 Rockmill St
- 413 Steeplechase St
- 736 Swanson St
- 72 Colfret Ct
- 175 Firestone Dr
- 123 Helen Ct
- 169 Hillside Dr
- 644 Boulder Dr
- 336 Onyx Ln
- 50 Perkins Ave
- 0 South St
- 547 Pagoda Loop
- 448 W William St
- 220 Rock Creek Dr
- 204 Rock Creek Dr
- 235 Hearthstone Dr
- 196 Rock Creek Dr
- 228 Rock Creek Dr
- 239 Hearthstone Dr
- 221 Rock Creek Dr
- 211 Rock Creek Dr
- 243 Hearthstone Dr
- 229 Rock Creek Dr
- 236 Rock Creek Dr
- 188 Rock Creek Dr
- 205 Rock Creek Dr
- 227 Hearthstone Dr
- 237 Rockcreek Dr
- 237 Rock Creek Dr
- 197 Rock Creek Dr
- 244 Rock Creek Dr
- 180 Rock Creek Dr
- 245 Rockcreek Dr