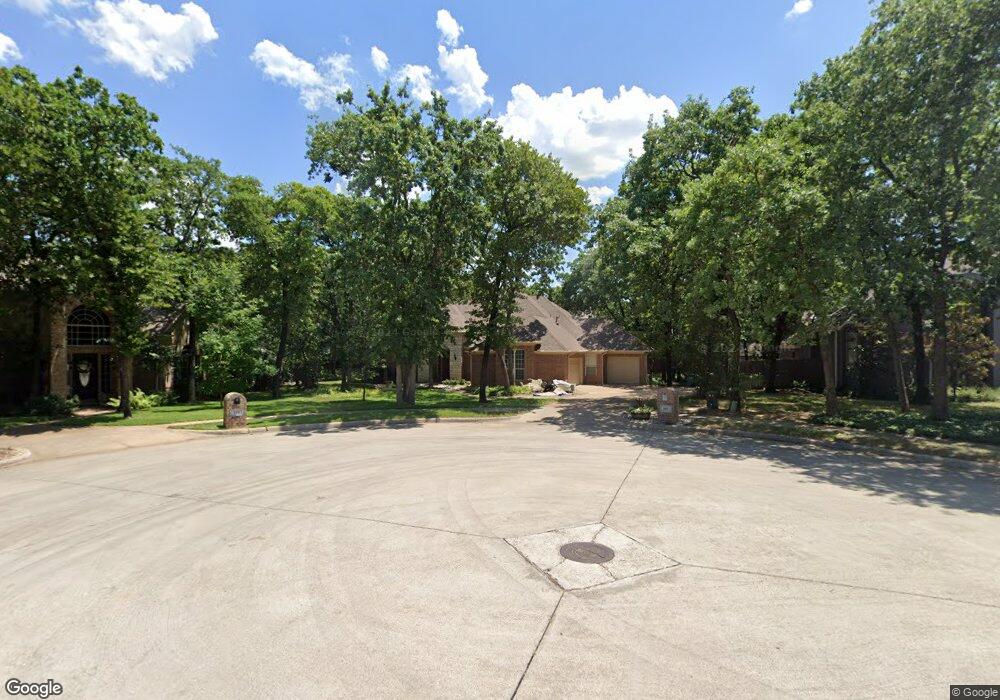
212 Royal Oaks Place Denton, TX 76210
South Denton NeighborhoodEstimated Value: $671,444 - $720,000
4
Beds
3
Baths
3,151
Sq Ft
$218/Sq Ft
Est. Value
About This Home
This home is located at 212 Royal Oaks Place, Denton, TX 76210 and is currently estimated at $686,111, approximately $217 per square foot. 212 Royal Oaks Place is a home located in Denton County with nearby schools including Ryan Elementary School, McMath Middle School, and Denton High School.
Ownership History
Date
Name
Owned For
Owner Type
Purchase Details
Closed on
May 6, 2020
Sold by
Spann Coletou and Denham Julie
Bought by
Mayfield Mitch and Mayfield Stephanie
Current Estimated Value
Home Financials for this Owner
Home Financials are based on the most recent Mortgage that was taken out on this home.
Original Mortgage
$112,500
Outstanding Balance
$79,052
Interest Rate
3.5%
Mortgage Type
New Conventional
Estimated Equity
$607,059
Purchase Details
Closed on
Nov 27, 2017
Sold by
Bain David W and Ahrens Susan C
Bought by
Spann Coleton and Denham Julie
Home Financials for this Owner
Home Financials are based on the most recent Mortgage that was taken out on this home.
Original Mortgage
$380,000
Interest Rate
3.88%
Mortgage Type
New Conventional
Purchase Details
Closed on
Aug 14, 2013
Sold by
Bain Joe William and Bain Ruth Lenora
Bought by
Bain Joe William and Joe W Bain Living Trust
Purchase Details
Closed on
Sep 22, 1995
Sold by
Howard Homes Inc
Bought by
Bain Joe W and Bain Ruth L
Create a Home Valuation Report for This Property
The Home Valuation Report is an in-depth analysis detailing your home's value as well as a comparison with similar homes in the area
Home Values in the Area
Average Home Value in this Area
Purchase History
| Date | Buyer | Sale Price | Title Company |
|---|---|---|---|
| Mayfield Mitch | -- | None Available | |
| Spann Coleton | -- | Freedom Title | |
| Bain Joe William | -- | None Available | |
| Bain Joe W | -- | -- |
Source: Public Records
Mortgage History
| Date | Status | Borrower | Loan Amount |
|---|---|---|---|
| Open | Mayfield Mitch | $112,500 | |
| Previous Owner | Spann Coleton | $380,000 |
Source: Public Records
Tax History Compared to Growth
Tax History
| Year | Tax Paid | Tax Assessment Tax Assessment Total Assessment is a certain percentage of the fair market value that is determined by local assessors to be the total taxable value of land and additions on the property. | Land | Improvement |
|---|---|---|---|---|
| 2025 | $10,593 | $648,141 | $186,977 | $461,164 |
| 2024 | $11,792 | $610,916 | $0 | $0 |
| 2023 | $9,403 | $555,378 | $202,752 | $511,248 |
| 2022 | $10,718 | $504,889 | $133,555 | $387,173 |
| 2021 | $10,204 | $458,990 | $106,794 | $352,196 |
| 2020 | $9,280 | $406,013 | $106,794 | $299,219 |
| 2019 | $9,699 | $406,505 | $106,794 | $299,711 |
| 2018 | $9,746 | $403,460 | $106,794 | $296,666 |
| 2017 | $9,608 | $388,711 | $106,794 | $282,953 |
| 2016 | $5,933 | $353,374 | $71,196 | $282,178 |
| 2015 | $5,636 | $329,000 | $71,196 | $257,804 |
| 2014 | $5,636 | $311,893 | $71,196 | $240,697 |
| 2013 | -- | $318,797 | $62,297 | $256,500 |
Source: Public Records
Map
Nearby Homes
- 3916 Maggies Meadow
- 9 Royal Oaks Cir
- 4100 Willow Grove Ave
- 21 Wellington Oaks Cir
- 33 Oak Forrest Cir
- 9 Oak Forrest Cir
- 900 Mallard Ave
- 4200 Thistle Hill
- 813 Turtle Creek Ave
- 100 Bentwood Ct
- 3805 Granada Trail
- 3601 Montecito Dr
- 3612 Granada Trail
- 917 Fallbrook Ave
- 1008 Turtle Creek Ave
- 3808 Montecito Dr
- 5508 Thistle Hill
- Type - 2 Plan at Ryan Woods
- 1008 Fallbrook Ave
- 4212 Stonetrail Dr
- 216 Royal Oaks Place
- 209 Royal Oaks Ct
- 208 Royal Oaks Place
- 213 Royal Oaks Ct
- 205 Royal Oaks Ct
- 3855 Leisure Ln
- 211 Royal Oaks Place
- 204 Royal Oaks Place
- 3825 Leisure Ln
- 201 Royal Oaks Ct
- 203 Royal Oaks Place
- 214 Royal Oaks Ct
- 3620 Bentley Ct
- 210 Royal Oaks Ct
- 206 Royal Oaks Ct
- 3815 Leisure Ln
- 0 Leisure Ln Unit 13268932
- 206 Wellington Oaks Ct
- Lot 1 Leisure Ln
- Lot 2 Leisure Ln