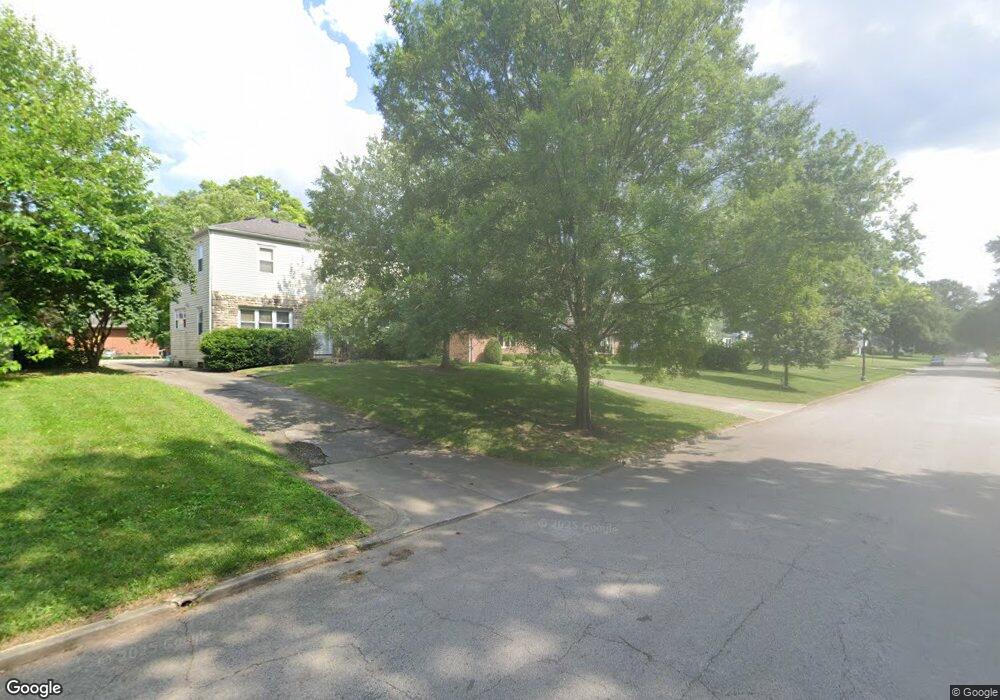
212 S Broadleigh Rd Columbus, OH 43209
Eastmoor NeighborhoodEstimated Value: $504,000 - $606,000
3
Beds
4
Baths
2,561
Sq Ft
$217/Sq Ft
Est. Value
About This Home
This home is located at 212 S Broadleigh Rd, Columbus, OH 43209 and is currently estimated at $556,687, approximately $217 per square foot. 212 S Broadleigh Rd is a home located in Franklin County with nearby schools including Fairmoor Elementary School, Johnson Park Middle School, and Walnut Ridge High School.
Ownership History
Date
Name
Owned For
Owner Type
Purchase Details
Closed on
May 14, 2009
Sold by
Schwartz Renia and Schwartz Susan
Bought by
A L East Real Estate Ii Llc
Current Estimated Value
Home Financials for this Owner
Home Financials are based on the most recent Mortgage that was taken out on this home.
Original Mortgage
$318,500
Outstanding Balance
$198,290
Interest Rate
4.9%
Mortgage Type
Future Advance Clause Open End Mortgage
Estimated Equity
$358,397
Purchase Details
Closed on
Dec 15, 2005
Sold by
Schwartz Renia and Schwartz Joel L
Bought by
Smith Kathleen Eberle
Purchase Details
Closed on
Apr 19, 1999
Sold by
Estate Of Abraham Schwartz
Bought by
Schwartz Renia
Purchase Details
Closed on
Jan 6, 1976
Bought by
Schwartz Abraham and Schwartz Renia
Create a Home Valuation Report for This Property
The Home Valuation Report is an in-depth analysis detailing your home's value as well as a comparison with similar homes in the area
Home Values in the Area
Average Home Value in this Area
Purchase History
| Date | Buyer | Sale Price | Title Company |
|---|---|---|---|
| A L East Real Estate Ii Llc | $338,500 | Hummel Titl | |
| Smith Kathleen Eberle | $250,000 | Bexley Titl | |
| Schwartz Renia | -- | -- | |
| Schwartz Renia | -- | -- | |
| Schwartz Abraham | -- | -- |
Source: Public Records
Mortgage History
| Date | Status | Borrower | Loan Amount |
|---|---|---|---|
| Open | A L East Real Estate Ii Llc | $318,500 |
Source: Public Records
Tax History
| Year | Tax Paid | Tax Assessment Tax Assessment Total Assessment is a certain percentage of the fair market value that is determined by local assessors to be the total taxable value of land and additions on the property. | Land | Improvement |
|---|---|---|---|---|
| 2025 | $6,368 | $151,690 | $45,850 | $105,840 |
| 2024 | $6,368 | $151,690 | $45,850 | $105,840 |
| 2023 | $6,315 | $151,690 | $45,850 | $105,840 |
| 2022 | $5,649 | $117,670 | $31,080 | $86,590 |
| 2021 | $5,659 | $117,670 | $31,080 | $86,590 |
| 2020 | $5,666 | $117,670 | $31,080 | $86,590 |
| 2019 | $5,213 | $94,680 | $24,890 | $69,790 |
| 2018 | $4,851 | $94,680 | $24,890 | $69,790 |
| 2017 | $5,210 | $94,680 | $24,890 | $69,790 |
| 2016 | $4,958 | $83,590 | $23,280 | $60,310 |
| 2015 | $4,500 | $83,590 | $23,280 | $60,310 |
| 2014 | $4,511 | $83,590 | $23,280 | $60,310 |
| 2013 | $2,225 | $83,580 | $23,275 | $60,305 |
Source: Public Records
Map
Nearby Homes
- 41 S Broadleigh Rd
- 125 S Stanwood Rd
- 181 S Kellner Rd
- 277 S James Rd
- 2731 E Broad St
- 161 S James Rd
- 430 S James Rd
- 279 S Ashburton Rd
- 3191 E Broad St
- 52 N Ardmore Rd
- 161 N Gould Rd
- 669 Brookside Dr
- 2604 Sherwood Rd
- 290 S Hampton Rd
- 205 N Gould Rd
- 177 S Hampton Rd
- 103 N Ardmore Rd
- 712 Chelsea Ave
- 2465 E Broad St
- 2417 Fair Ave
- 204 S Broadleigh Rd
- 198 S Broadleigh Rd
- 219 S Chesterfield Rd
- 232 S Broadleigh Rd
- 211 S Chesterfield Rd
- 227 S Chesterfield Rd
- 190 S Broadleigh Rd
- 205 S Chesterfield Rd
- 209 S Broadleigh Rd
- 199 S Broadleigh Rd
- 184 S Broadleigh Rd
- 219 S Broadleigh Rd
- 239 S Chesterfield Rd
- 199 S Chesterfield Rd
- 195 S Broadleigh Rd
- 220 S Broadleigh Rd
- 227 S Broadleigh Rd
- 187 S Broadleigh Rd
- 191 S Chesterfield Rd
- 178 S Broadleigh Rd
Your Personal Tour Guide
Ask me questions while you tour the home.