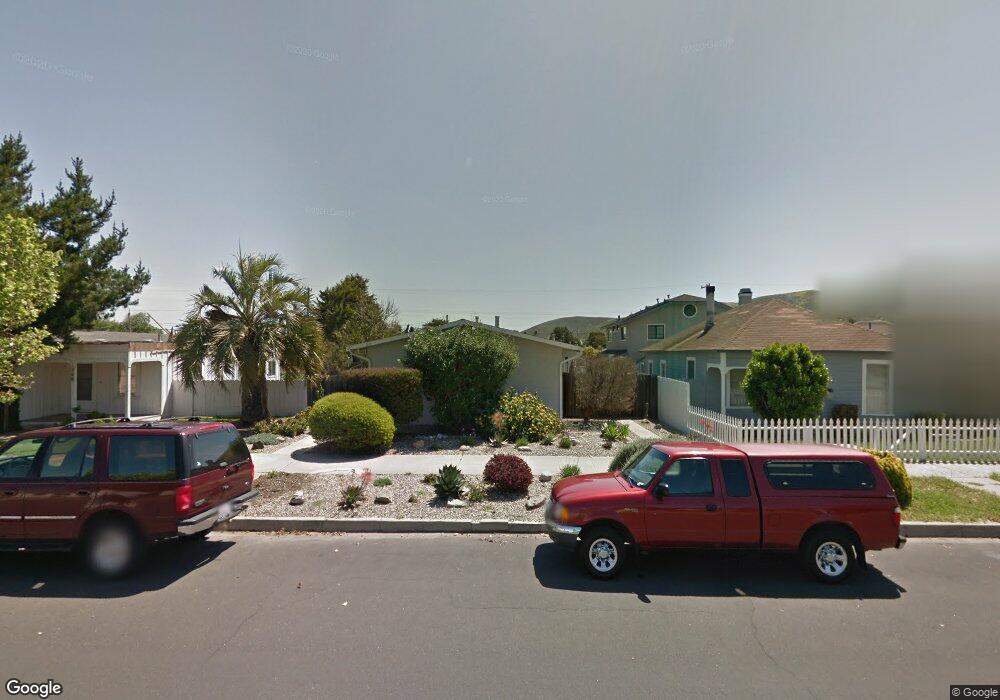
212 S G St Lompoc, CA 93436
Estimated Value: $644,000 - $777,000
6
Beds
3
Baths
2,200
Sq Ft
$331/Sq Ft
Est. Value
About This Home
This home is located at 212 S G St, Lompoc, CA 93436 and is currently estimated at $728,526, approximately $331 per square foot. 212 S G St is a home located in Santa Barbara County with nearby schools including Arthur Hapgood Elementary School, Lompoc Valley Middle School, and Lompoc High School.
Ownership History
Date
Name
Owned For
Owner Type
Purchase Details
Closed on
Sep 25, 2024
Sold by
Carole L Fossett Family Trust and Hoffman Family Trust
Bought by
Arriaga Sergio Antonio and Arriaga Ramon Esparza
Current Estimated Value
Home Financials for this Owner
Home Financials are based on the most recent Mortgage that was taken out on this home.
Original Mortgage
$245,000
Outstanding Balance
$242,295
Interest Rate
6.09%
Mortgage Type
New Conventional
Estimated Equity
$486,231
Purchase Details
Closed on
May 6, 2005
Sold by
Fossett Carole Lynn
Bought by
Fossett Carole L and Carole L Fossett Family Trust
Purchase Details
Closed on
Jun 1, 2004
Sold by
Fossett Carole Lynn and Hoffman Carl Joseph
Bought by
Fossett Carole Lynn and Hoffman Carl Joseph
Purchase Details
Closed on
Jul 10, 2000
Sold by
Trste Hoffman Carl Joseph and Hoffman Fam Tr 4-14-89
Bought by
Hoffman Phyllis Regina and Hoffman Credit Shelter B Trust
Create a Home Valuation Report for This Property
The Home Valuation Report is an in-depth analysis detailing your home's value as well as a comparison with similar homes in the area
Home Values in the Area
Average Home Value in this Area
Purchase History
| Date | Buyer | Sale Price | Title Company |
|---|---|---|---|
| Arriaga Sergio Antonio | $750,000 | First American Title | |
| Fossett Carole L | -- | -- | |
| Fossett Carole Lynn | -- | -- | |
| Hoffman Phyllis Regina | -- | -- |
Source: Public Records
Mortgage History
| Date | Status | Borrower | Loan Amount |
|---|---|---|---|
| Open | Arriaga Sergio Antonio | $245,000 |
Source: Public Records
Tax History
| Year | Tax Paid | Tax Assessment Tax Assessment Total Assessment is a certain percentage of the fair market value that is determined by local assessors to be the total taxable value of land and additions on the property. | Land | Improvement |
|---|---|---|---|---|
| 2025 | $2,908 | $750,000 | $180,000 | $570,000 |
| 2023 | $2,908 | $254,090 | $84,976 | $169,114 |
| 2022 | $2,857 | $249,109 | $83,310 | $165,799 |
| 2021 | $2,888 | $244,226 | $81,677 | $162,549 |
| 2020 | $2,858 | $241,723 | $80,840 | $160,883 |
| 2019 | $2,810 | $236,984 | $79,255 | $157,729 |
| 2018 | $2,767 | $232,338 | $77,701 | $154,637 |
| 2017 | $2,716 | $227,783 | $76,178 | $151,605 |
| 2016 | $2,667 | $223,318 | $74,685 | $148,633 |
| 2014 | $2,611 | $215,657 | $72,123 | $143,534 |
Source: Public Records
Map
Nearby Homes
Your Personal Tour Guide
Ask me questions while you tour the home.