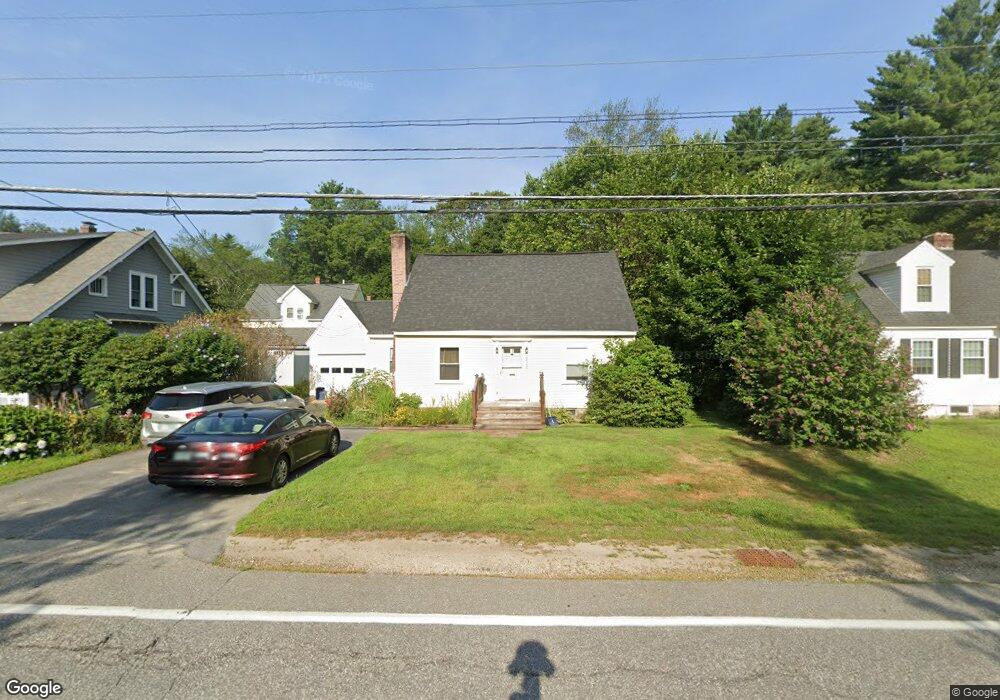
212 South St Concord, NH 03301
South End NeighborhoodEstimated Value: $449,163 - $559,000
3
Beds
2
Baths
1,618
Sq Ft
$303/Sq Ft
Est. Value
About This Home
This home is located at 212 South St, Concord, NH 03301 and is currently estimated at $490,541, approximately $303 per square foot. 212 South St is a home located in Merrimack County with nearby schools including Abbot-Downing School, Rundlett Middle School, and Concord High School.
Ownership History
Date
Name
Owned For
Owner Type
Purchase Details
Closed on
Jul 28, 2000
Sold by
Doughty Nellie J
Bought by
Poole Dennis M
Current Estimated Value
Home Financials for this Owner
Home Financials are based on the most recent Mortgage that was taken out on this home.
Original Mortgage
$132,905
Interest Rate
8.18%
Mortgage Type
Purchase Money Mortgage
Create a Home Valuation Report for This Property
The Home Valuation Report is an in-depth analysis detailing your home's value as well as a comparison with similar homes in the area
Home Values in the Area
Average Home Value in this Area
Purchase History
| Date | Buyer | Sale Price | Title Company |
|---|---|---|---|
| Poole Dennis M | $139,900 | -- |
Source: Public Records
Mortgage History
| Date | Status | Borrower | Loan Amount |
|---|---|---|---|
| Open | Poole Dennis M | $203,000 | |
| Closed | Poole Dennis M | $132,905 |
Source: Public Records
Tax History Compared to Growth
Tax History
| Year | Tax Paid | Tax Assessment Tax Assessment Total Assessment is a certain percentage of the fair market value that is determined by local assessors to be the total taxable value of land and additions on the property. | Land | Improvement |
|---|---|---|---|---|
| 2024 | $7,402 | $267,300 | $108,500 | $158,800 |
| 2023 | $7,180 | $267,300 | $108,500 | $158,800 |
| 2022 | $6,920 | $267,300 | $108,500 | $158,800 |
| 2021 | $6,632 | $264,000 | $108,500 | $155,500 |
| 2020 | $6,297 | $235,300 | $86,600 | $148,700 |
| 2019 | $5,184 | $186,600 | $85,000 | $101,600 |
| 2018 | $5,229 | $185,500 | $85,000 | $100,500 |
| 2017 | $5,134 | $181,800 | $85,000 | $96,800 |
| 2016 | $4,851 | $175,300 | $83,400 | $91,900 |
| 2015 | $4,640 | $169,500 | $87,000 | $82,500 |
| 2014 | $4,544 | $169,500 | $87,000 | $82,500 |
| 2013 | -- | $167,900 | $87,000 | $80,900 |
| 2012 | -- | $166,000 | $87,000 | $79,000 |
Source: Public Records
Map
Nearby Homes