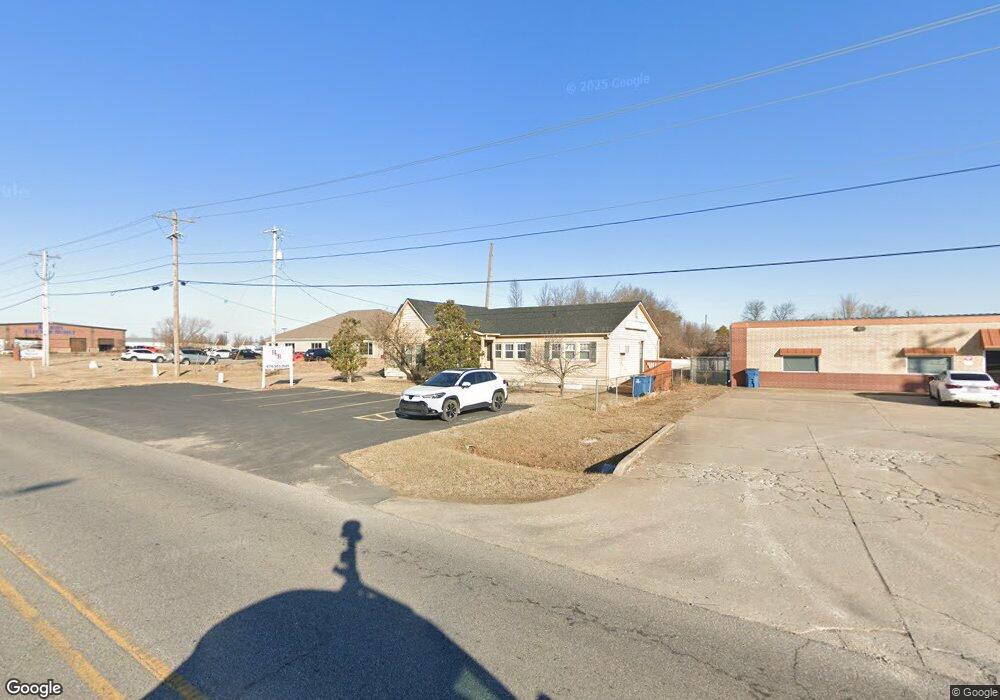
212 SW 28th St Bentonville, AR 72712
Estimated Value: $271,941
--
Bed
--
Bath
1,520
Sq Ft
$179/Sq Ft
Est. Value
About This Home
This home is located at 212 SW 28th St, Bentonville, AR 72712 and is currently estimated at $271,941, approximately $178 per square foot. 212 SW 28th St is a home located in Benton County with nearby schools including Ruth Barker Middle School, Mary Mae Jones Elementary School, and Fulbright Junior High School.
Ownership History
Date
Name
Owned For
Owner Type
Purchase Details
Closed on
Apr 20, 2018
Sold by
Bolejack Cindy and B & B Property Investments Llc
Bought by
Bolejack Steve and B & B Property Investments Llc
Current Estimated Value
Purchase Details
Closed on
Apr 25, 2013
Sold by
Big Sugar Properties Inc
Bought by
B & B Property Investments Llc
Home Financials for this Owner
Home Financials are based on the most recent Mortgage that was taken out on this home.
Original Mortgage
$108,800
Interest Rate
3.61%
Purchase Details
Closed on
May 23, 2008
Sold by
The Appraisal Group Of Northwest Ar Llc
Bought by
Big Sugar Properties Inc
Purchase Details
Closed on
Dec 3, 2002
Bought by
App Group
Purchase Details
Closed on
Oct 27, 1999
Bought by
C/A Holdings
Purchase Details
Closed on
Aug 20, 1991
Bought by
Craker
Purchase Details
Closed on
Jun 29, 1990
Bought by
Quisenberry
Create a Home Valuation Report for This Property
The Home Valuation Report is an in-depth analysis detailing your home's value as well as a comparison with similar homes in the area
Home Values in the Area
Average Home Value in this Area
Purchase History
| Date | Buyer | Sale Price | Title Company |
|---|---|---|---|
| Bolejack Steve | -- | None Available | |
| B & B Property Investments Llc | $128,000 | Mercury Title Llc | |
| Big Sugar Properties Inc | $145,000 | None Available | |
| App Group | $82,000 | -- | |
| C/A Holdings | $42,000 | -- | |
| Craker | $40,000 | -- | |
| Quisenberry | $165,000 | -- |
Source: Public Records
Mortgage History
| Date | Status | Borrower | Loan Amount |
|---|---|---|---|
| Closed | B & B Property Investments Llc | $108,800 |
Source: Public Records
Tax History Compared to Growth
Tax History
| Year | Tax Paid | Tax Assessment Tax Assessment Total Assessment is a certain percentage of the fair market value that is determined by local assessors to be the total taxable value of land and additions on the property. | Land | Improvement |
|---|---|---|---|---|
| 2025 | $3,235 | $65,742 | $25,346 | $40,396 |
| 2024 | $2,979 | $65,742 | $25,346 | $40,396 |
| 2023 | $2,708 | $46,850 | $22,230 | $24,620 |
| 2022 | $2,560 | $46,850 | $22,230 | $24,620 |
| 2021 | $2,339 | $46,850 | $22,230 | $24,620 |
| 2020 | $2,147 | $36,430 | $14,550 | $21,880 |
| 2019 | $2,004 | $36,430 | $14,550 | $21,880 |
| 2018 | $1,861 | $36,430 | $14,550 | $21,880 |
| 2017 | $1,717 | $36,430 | $14,550 | $21,880 |
| 2016 | $1,525 | $36,430 | $14,550 | $21,880 |
| 2015 | $1,388 | $22,460 | $15,230 | $7,230 |
| 2014 | $1,388 | $22,460 | $15,230 | $7,230 |
Source: Public Records
Map
Nearby Homes
- 0 SE C St
- 2105 S Walton Blvd
- 404 SW 20th St
- 404 SW Regional Airport Blvd Unit Lot 1
- 404 SW Regional Airport Blvd Unit Lot 3
- 0 SW Winsted Ln Unit 1296348
- 0 SW Winsted Ln Unit 1296309
- 1801 SW E St
- 0 SW I St Unit 1317853
- 2400 SW I St
- 215 Winesap Ln
- 2503 SW Moorland St
- 2500 SW Moorland St
- 215 Jonathan Dr
- 10 Mcintosh Ln
- 1501 S Rainbow Rd
- 1106 SE 34th St
- 1108 SE 34th St
- 105 SE 14th St
- 801 SE Jon Dr
- 200 SW 28th St
- 0 Airport Road & Regency Pkwy
- 0 Airport Road & Regency Pkwy
- 2812 S Walton Blvd
- 2904 S Walton Blvd
- 2806 S Walton Blvd
- 210 Airport Rd
- 4 SW 28th St
- 11.87 Acre E 28th St
- Lot 7 SE 28th St
- 6.6Ac SE 28th St
- 2706 S Walton Blvd
- 0 SW Regency Park Unit 538441
- Regency Sw Pkwy
- 0 SW Regency Pkwy Unit 669683
- 0 SW Regency Blvd Unit 669686
- 0 SW Regency Pkwy Unit 669645
- 0 SW Airport Rd
- 3000 SW Regency Pkwy
- 3000 SW Regency Pkwy Unit 16