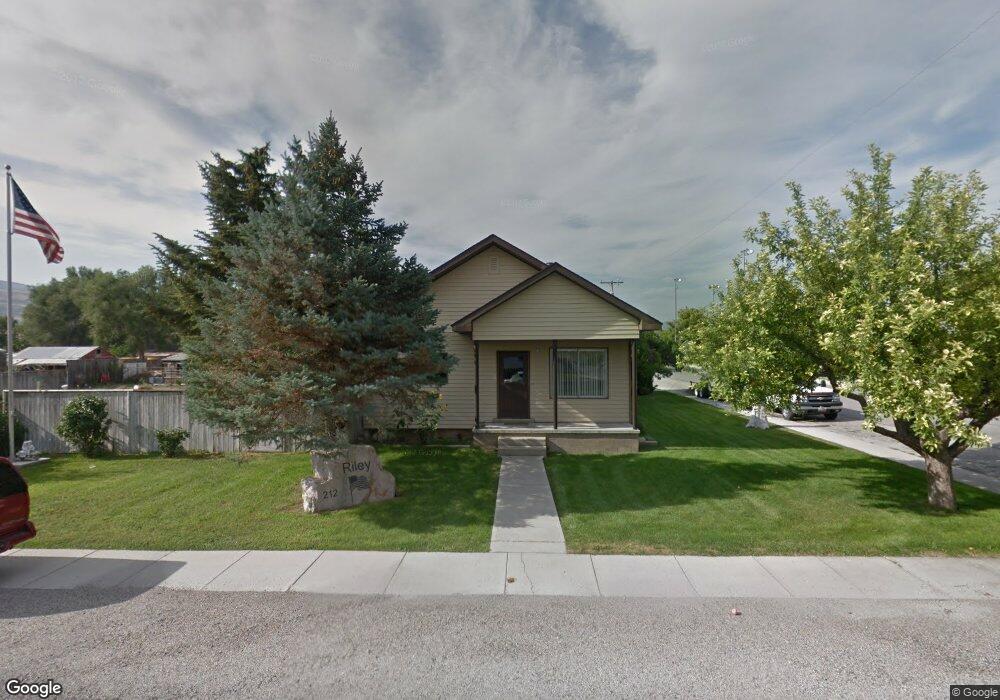
212 W 100 N Garland, UT 84312
Estimated Value: $311,000 - $371,518
--
Bed
--
Bath
1,557
Sq Ft
$224/Sq Ft
Est. Value
About This Home
This home is located at 212 W 100 N, Garland, UT 84312 and is currently estimated at $348,880, approximately $224 per square foot. 212 W 100 N is a home located in Box Elder County with nearby schools including Fielding School, Bear River Middle School, and Alice C. Harris Intermediate School.
Ownership History
Date
Name
Owned For
Owner Type
Purchase Details
Closed on
Aug 29, 2024
Sold by
Riley Mark
Bought by
Riley Family Investments Llc
Current Estimated Value
Home Financials for this Owner
Home Financials are based on the most recent Mortgage that was taken out on this home.
Original Mortgage
$301,000
Outstanding Balance
$299,162
Interest Rate
6.77%
Mortgage Type
New Conventional
Estimated Equity
$49,718
Purchase Details
Closed on
Dec 30, 2011
Sold by
Riley Mark and Riley Matthew J
Bought by
Riley Family Investments Llc
Home Financials for this Owner
Home Financials are based on the most recent Mortgage that was taken out on this home.
Original Mortgage
$95,000
Interest Rate
3.93%
Mortgage Type
New Conventional
Purchase Details
Closed on
Mar 1, 2007
Sold by
Martinez Roberto and Martinez Juan A
Bought by
Wells Fargo Bank Na
Create a Home Valuation Report for This Property
The Home Valuation Report is an in-depth analysis detailing your home's value as well as a comparison with similar homes in the area
Home Values in the Area
Average Home Value in this Area
Purchase History
| Date | Buyer | Sale Price | Title Company |
|---|---|---|---|
| Riley Family Investments Llc | -- | Northern Title | |
| Riley Mark | -- | Northern Title | |
| Riley Family Investments Llc | -- | None Available | |
| Wells Fargo Bank Na | $110,312 | None Available |
Source: Public Records
Mortgage History
| Date | Status | Borrower | Loan Amount |
|---|---|---|---|
| Open | Riley Mark | $301,000 | |
| Previous Owner | Riley Mark A | $95,000 | |
| Previous Owner | Riley Mark | $96,000 | |
| Previous Owner | Bolingbroke Jason | $209,856 | |
| Previous Owner | Riley Mark | $92,500 | |
| Previous Owner | Martinez Roberto | $104,493 |
Source: Public Records
Tax History Compared to Growth
Tax History
| Year | Tax Paid | Tax Assessment Tax Assessment Total Assessment is a certain percentage of the fair market value that is determined by local assessors to be the total taxable value of land and additions on the property. | Land | Improvement |
|---|---|---|---|---|
| 2024 | $2,128 | $361,000 | $105,000 | $256,000 |
| 2023 | $2,539 | $422,933 | $100,000 | $322,933 |
| 2022 | $2,147 | $370,762 | $30,000 | $340,762 |
| 2021 | $1,901 | $244,395 | $30,000 | $214,395 |
| 2020 | $1,616 | $244,395 | $30,000 | $214,395 |
| 2019 | $1,497 | $120,852 | $16,500 | $104,352 |
| 2018 | $913 | $68,526 | $13,750 | $54,776 |
| 2017 | $958 | $124,593 | $13,750 | $99,593 |
| 2016 | $944 | $65,918 | $13,750 | $52,168 |
| 2015 | $861 | $61,175 | $13,750 | $47,425 |
| 2014 | $861 | $58,917 | $13,750 | $45,167 |
| 2013 | -- | $58,918 | $13,338 | $45,580 |
Source: Public Records
Map
Nearby Homes
- 112 S Main St
- 263 E Factory St
- 363 E Factory St
- 884 W Factory St
- 831 S 300 W
- 1260 S Riverview Dr
- 375 E 1250 S
- 90 E 1300 S
- 981 N Tremont St
- 960 N 100 W
- 844 N 400 E
- 925 W 1000 N
- 235 E 800 N Unit 2
- 959 N 900 W
- 953 N 900 W
- 898 N 870 W Unit 97
- 789 N 100 W
- 1403 E 1230 S Unit 45
- 892 N 900 W
- 933 N 960 W Unit W4