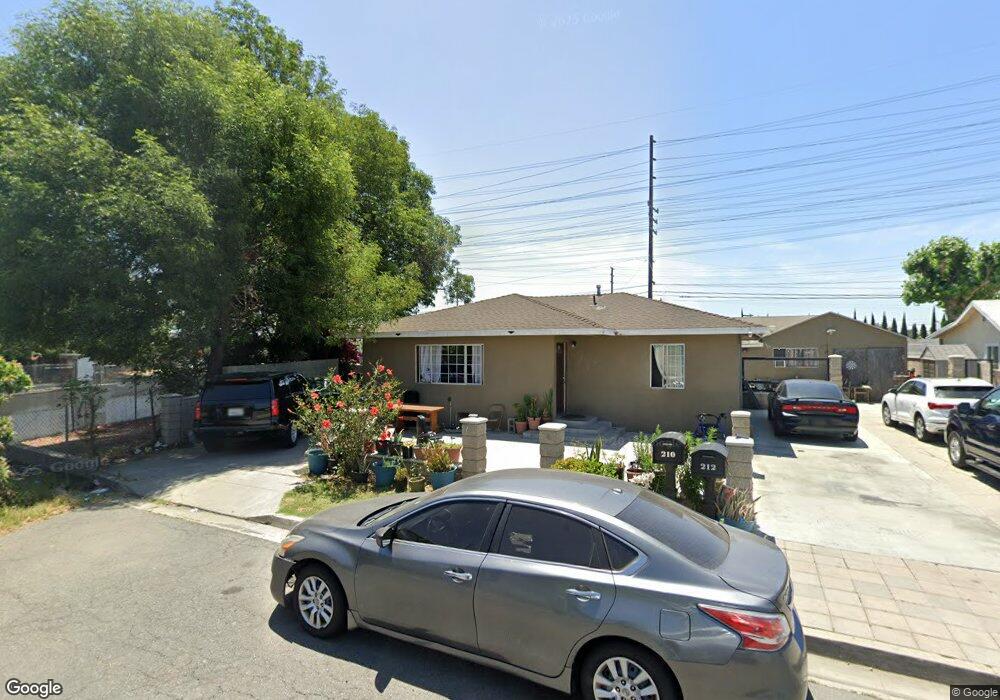
212 W Glencoe St Compton, CA 90220
Estimated Value: $643,000 - $786,000
4
Beds
2
Baths
1,729
Sq Ft
$413/Sq Ft
Est. Value
About This Home
This home is located at 212 W Glencoe St, Compton, CA 90220 and is currently estimated at $713,406, approximately $412 per square foot. 212 W Glencoe St is a home located in Los Angeles County with nearby schools including Robert F. Kennedy Elementary School, Walton Middle School, and Compton High School.
Ownership History
Date
Name
Owned For
Owner Type
Purchase Details
Closed on
Sep 15, 2011
Sold by
Fido Elisapeta
Bought by
Fido Martin L and Fido Carol O
Current Estimated Value
Purchase Details
Closed on
Dec 15, 1995
Sold by
David Lealofi and David Suluafi P
Bought by
Fido Leonard P and Fido Elisapeta S
Home Financials for this Owner
Home Financials are based on the most recent Mortgage that was taken out on this home.
Original Mortgage
$24,000
Outstanding Balance
$329
Interest Rate
7.38%
Estimated Equity
$713,077
Create a Home Valuation Report for This Property
The Home Valuation Report is an in-depth analysis detailing your home's value as well as a comparison with similar homes in the area
Home Values in the Area
Average Home Value in this Area
Purchase History
| Date | Buyer | Sale Price | Title Company |
|---|---|---|---|
| Fido Martin L | -- | None Available | |
| Fido Leonard P | -- | Commonwealth Land Title |
Source: Public Records
Mortgage History
| Date | Status | Borrower | Loan Amount |
|---|---|---|---|
| Open | Fido Leonard P | $24,000 |
Source: Public Records
Tax History
| Year | Tax Paid | Tax Assessment Tax Assessment Total Assessment is a certain percentage of the fair market value that is determined by local assessors to be the total taxable value of land and additions on the property. | Land | Improvement |
|---|---|---|---|---|
| 2025 | $2,721 | $69,242 | $21,451 | $47,791 |
| 2024 | $2,683 | $67,885 | $21,031 | $46,854 |
| 2023 | $2,633 | $66,555 | $20,619 | $45,936 |
| 2022 | $1,896 | $65,251 | $20,215 | $45,036 |
| 2021 | $1,895 | $63,972 | $19,819 | $44,153 |
| 2020 | $1,874 | $63,317 | $19,616 | $43,701 |
| 2019 | $1,856 | $62,077 | $19,232 | $42,845 |
| 2018 | $1,682 | $60,860 | $18,855 | $42,005 |
| 2016 | $1,601 | $58,499 | $18,124 | $40,375 |
| 2015 | $1,550 | $57,621 | $17,852 | $39,769 |
| 2014 | $1,544 | $56,493 | $17,503 | $38,990 |
Source: Public Records
Map
Nearby Homes
- 112 E Caldwell St
- 214 E Johnson St
- 920 S Willowbrook Ave
- 229 E Reeve St
- 114 E Alondra Blvd
- 125 E Alondra Blvd
- 136 S Tulip Ave
- 1680 S Tartar Ln Unit 42
- 1230 S Wilmington Ave
- 1540 S Pearl Ave
- 512 S Willowbrook Ave
- 201 Racquet Club Dr
- 1300 S California Ave
- 426 W Laurel St
- 623 W Indigo St
- 427 W Laurel St
- 165 Racquet Club Dr
- 1100 E Tichenor St
- 1423 S Sloan Ave
- 524 W Laurel St
- 1606 S Acacia Ave
- 1602 S Acacia Ave
- 217 W Glencoe St
- 116 W Glencoe St
- 201 W Glencoe St
- 1512 S Acacia Ave
- 121 W Glencoe St
- 1605 S Acacia Ave
- 1601 S Acacia Ave
- 112 W Glencoe St
- 113 W Glencoe St
- 1508 S Acacia Ave
- 305 W Glencoe St
- 206 W Bennett St
- 109 W Glencoe St
- 1513 S Acacia Ave
- 108 W Glencoe St
- 208 W Bennett St
- 1504 S Acacia Ave
- 200 W Bennett St
Your Personal Tour Guide
Ask me questions while you tour the home.