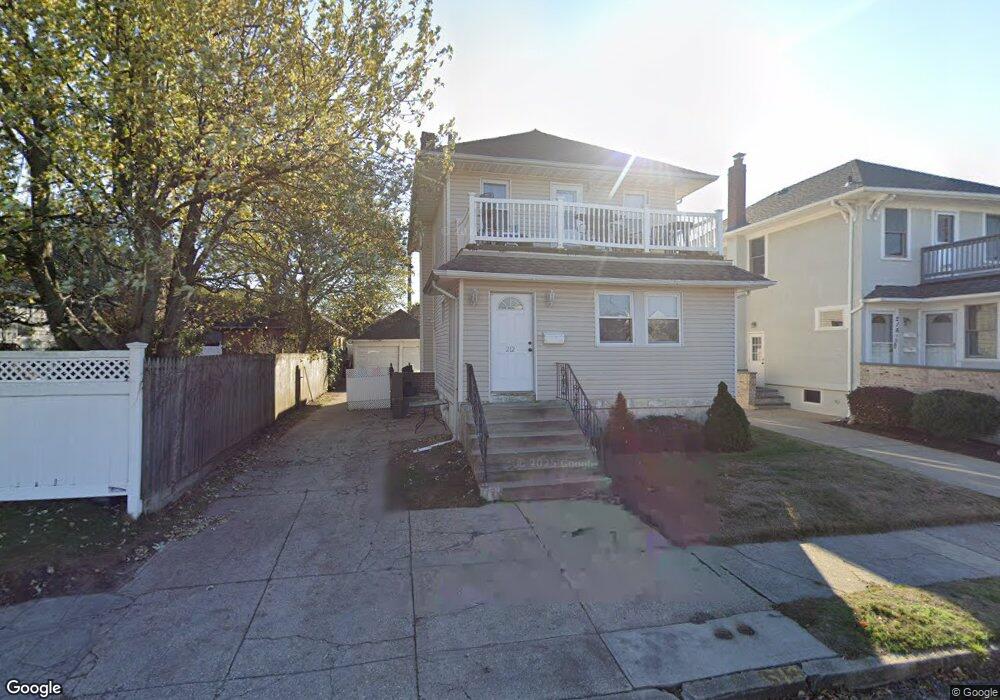
212 W Hudson St Unit Lower Long Beach, NY 11561
Estimated Value: $813,313 - $921,000
3
Beds
1
Bath
1,720
Sq Ft
$504/Sq Ft
Est. Value
About This Home
This home is located at 212 W Hudson St Unit Lower, Long Beach, NY 11561 and is currently estimated at $867,157, approximately $504 per square foot. 212 W Hudson St Unit Lower is a home located in Nassau County with nearby schools including Lido Elementary School, Lindell Elementary School, and East Elementary School.
Ownership History
Date
Name
Owned For
Owner Type
Purchase Details
Closed on
Apr 8, 2021
Sold by
West Hudson Lb Corp
Bought by
Guan Hong
Current Estimated Value
Home Financials for this Owner
Home Financials are based on the most recent Mortgage that was taken out on this home.
Original Mortgage
$435,000
Outstanding Balance
$393,067
Interest Rate
3.05%
Mortgage Type
New Conventional
Estimated Equity
$474,090
Purchase Details
Closed on
Oct 6, 2008
Sold by
Greenpoint Mortgage Fundi
Bought by
West Hudson Lb Corp
Purchase Details
Closed on
May 20, 2008
Sold by
Stephen D Kutner
Bought by
Greenpoint Mortgage Fund
Purchase Details
Closed on
Jun 30, 2004
Sold by
Bhagwandin Premnauth
Purchase Details
Closed on
Apr 25, 2003
Sold by
Rampersaud Amar
Purchase Details
Closed on
Dec 16, 1997
Sold by
Sandovai Victor and Sandovai Adela
Bought by
Rampersald Amer and Bhagwandin
Create a Home Valuation Report for This Property
The Home Valuation Report is an in-depth analysis detailing your home's value as well as a comparison with similar homes in the area
Home Values in the Area
Average Home Value in this Area
Purchase History
| Date | Buyer | Sale Price | Title Company |
|---|---|---|---|
| Guan Hong | $725,000 | None Available | |
| Guan Hong | $725,000 | None Available | |
| West Hudson Lb Corp | $350,000 | -- | |
| West Hudson Lb Corp | $350,000 | -- | |
| Greenpoint Mortgage Fund | $496,920 | -- | |
| Greenpoint Mortgage Fund | $496,920 | -- | |
| -- | $545,000 | -- | |
| -- | $545,000 | -- | |
| -- | -- | -- | |
| -- | -- | -- | |
| Rampersald Amer | $175,000 | -- | |
| Rampersald Amer | $175,000 | -- |
Source: Public Records
Mortgage History
| Date | Status | Borrower | Loan Amount |
|---|---|---|---|
| Open | Guan Hong | $435,000 | |
| Closed | Guan Hong | $435,000 |
Source: Public Records
Tax History Compared to Growth
Tax History
| Year | Tax Paid | Tax Assessment Tax Assessment Total Assessment is a certain percentage of the fair market value that is determined by local assessors to be the total taxable value of land and additions on the property. | Land | Improvement |
|---|---|---|---|---|
| 2025 | $7,934 | $551 | $218 | $333 |
| 2024 | $938 | $542 | $215 | $327 |
| 2023 | $7,315 | $572 | $227 | $345 |
| 2022 | $7,315 | $563 | $223 | $340 |
| 2021 | $13,793 | $578 | $229 | $349 |
| 2020 | $10,552 | $656 | $655 | $1 |
| 2019 | $973 | $703 | $702 | $1 |
| 2018 | $4,349 | $750 | $0 | $0 |
| 2017 | $5,303 | $797 | $788 | $9 |
| 2016 | $984 | $844 | $623 | $221 |
| 2015 | $1,094 | $891 | $658 | $233 |
| 2014 | $1,094 | $891 | $658 | $233 |
| 2013 | $1,325 | $1,129 | $834 | $295 |
Source: Public Records
Map
Nearby Homes
- 236 W Pine St
- 227 W Pine St
- 245 W Chester St
- 185 W Park Ave Unit 209
- 235 W Park Ave Unit 503
- 328 W Fulton St
- 327 W Pine St
- 237 W Walnut St
- 520 Lafayette Blvd
- 122 W Walnut St
- 61 W Walnut St
- 161 W Beech St
- 16 E Pine St
- 20 E Pine St
- 211 Laurelton Blvd
- 230 W Beech St
- 42 E Hudson St
- 450 W Bay Dr
- 46 E Fulton St
- 274 W Beech St
- 212 W Hudson St Unit Upper
- 212 W Hudson St
- 216 W Hudson St
- 216 W Hudson St Unit Upper
- 519 Magnolia Blvd
- 220 W Hudson St
- 505 Magnolia Blvd
- 211 W Market St
- 215 W Market St
- 226 W Hudson St
- 501 Magnolia Blvd
- 501 Magnolia Blvd Unit Upper
- 225 W Market St
- 232 W Hudson St
- 229 W Market St
- 238 W Hudson St
- 225 W Hudson St
- 225HVY W Hudson St Unit 1
- 225HVY W Hudson St
- 225 W Hudson St Unit Upper