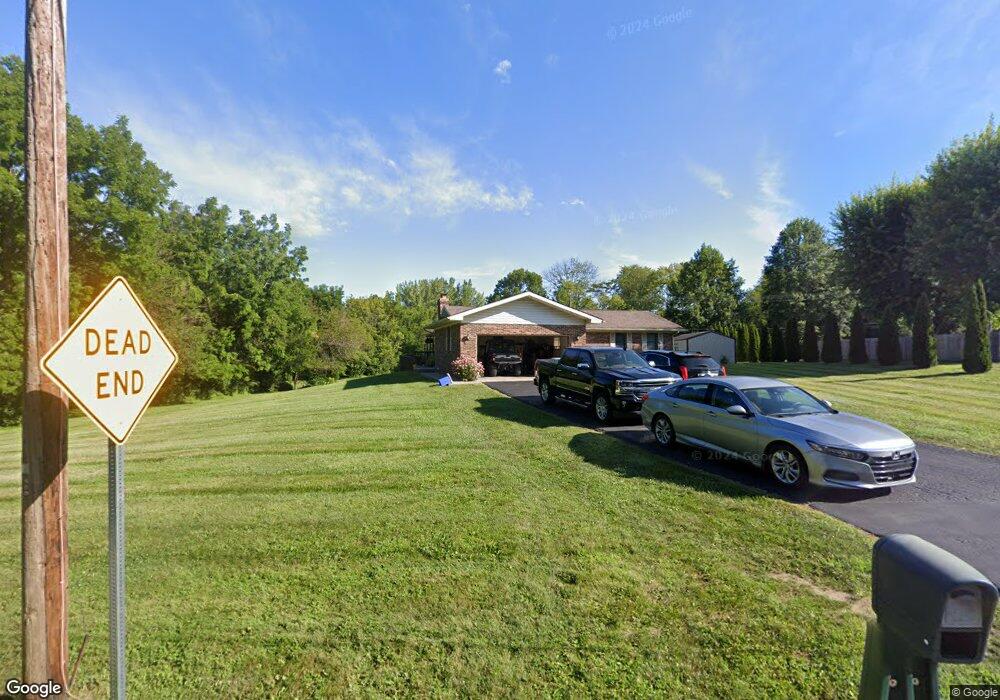
212 W Hunt Rd Rushville, IN 46173
Estimated Value: $317,331 - $352,000
--
Bed
2
Baths
1,908
Sq Ft
$177/Sq Ft
Est. Value
About This Home
This home is located at 212 W Hunt Rd, Rushville, IN 46173 and is currently estimated at $336,833, approximately $176 per square foot. 212 W Hunt Rd is a home located in Rush County with nearby schools including Rushville Consolidated High School and St. Mary Catholic School.
Ownership History
Date
Name
Owned For
Owner Type
Purchase Details
Closed on
Oct 25, 2019
Sold by
Curtis Kwin M
Bought by
Curtis Shaun A
Current Estimated Value
Home Financials for this Owner
Home Financials are based on the most recent Mortgage that was taken out on this home.
Original Mortgage
$196,000
Outstanding Balance
$172,601
Interest Rate
3.65%
Mortgage Type
New Conventional
Estimated Equity
$164,232
Purchase Details
Closed on
Jul 3, 2017
Sold by
Curtis Shaun A
Bought by
Curtis Shaun A and Curtis Kwin M
Home Financials for this Owner
Home Financials are based on the most recent Mortgage that was taken out on this home.
Original Mortgage
$148,000
Interest Rate
3.95%
Mortgage Type
New Conventional
Purchase Details
Closed on
Sep 15, 2014
Sold by
Curtis Kim
Bought by
Curtis Shaun A
Create a Home Valuation Report for This Property
The Home Valuation Report is an in-depth analysis detailing your home's value as well as a comparison with similar homes in the area
Home Values in the Area
Average Home Value in this Area
Purchase History
| Date | Buyer | Sale Price | Title Company |
|---|---|---|---|
| Curtis Shaun A | -- | None Available | |
| Curtis Shaun A | -- | None Available | |
| Curtis Shaun A | -- | None Available |
Source: Public Records
Mortgage History
| Date | Status | Borrower | Loan Amount |
|---|---|---|---|
| Open | Curtis Shaun A | $196,000 | |
| Closed | Curtis Shaun A | $148,000 |
Source: Public Records
Tax History Compared to Growth
Tax History
| Year | Tax Paid | Tax Assessment Tax Assessment Total Assessment is a certain percentage of the fair market value that is determined by local assessors to be the total taxable value of land and additions on the property. | Land | Improvement |
|---|---|---|---|---|
| 2024 | $2,714 | $267,400 | $34,300 | $233,100 |
| 2023 | $2,696 | $254,800 | $31,800 | $223,000 |
| 2022 | $2,475 | $234,300 | $29,300 | $205,000 |
| 2021 | $2,224 | $209,200 | $25,400 | $183,800 |
| 2020 | $2,105 | $197,600 | $23,900 | $173,700 |
| 2019 | $2,030 | $189,000 | $23,900 | $165,100 |
| 2018 | $2,037 | $187,300 | $23,900 | $163,400 |
| 2017 | $2,015 | $184,100 | $23,900 | $160,200 |
| 2016 | $1,662 | $160,000 | $23,900 | $136,100 |
| 2014 | $1,638 | $159,500 | $19,100 | $140,400 |
| 2013 | $1,638 | $163,200 | $19,100 | $144,100 |
Source: Public Records
Map
Nearby Homes
- 0 Eric South Ln
- 1157 S State Road 3
- 1112 U S Route 52
- 428 W Lawton Cir
- 190 E Willard Ave
- 324 W 1st St
- 433 W 2nd St
- 1350 S Ruth St
- 1364 S Ruth St
- 229 W 3rd St
- 221 N Julian St
- 136 E 3rd St
- 335 N Morgan St
- 421 W 5th St
- 520 N Jackson St
- 903 W 3rd St
- 605 N Perkins St
- 527 N Arthur St
- 316 E 5th St
- 611 N Arthur St
- 1011 S Beechwood Dr
- 1014 S Beechwood Dr
- 174 W Hunt Rd
- 1039 S Beechwood Dr
- 1015 S Walnut St
- 1035 S Walnut St
- 280 W Hunt Rd
- 1012 S Walnut St
- 1059 S Beechwood Dr
- 1056 S Beechwood Dr
- 1034 S Walnut St
- 1057 S Walnut St
- 281 W Hunt Rd
- 295 W Hunt Rd
- 1058 S Walnut St
- 175 W Schroeder Way
- 1073 S Beechwood Dr
- 214 W Kings Hwy
- 133 W Hunt Rd
- 133 W Hunt Rd Unit 1