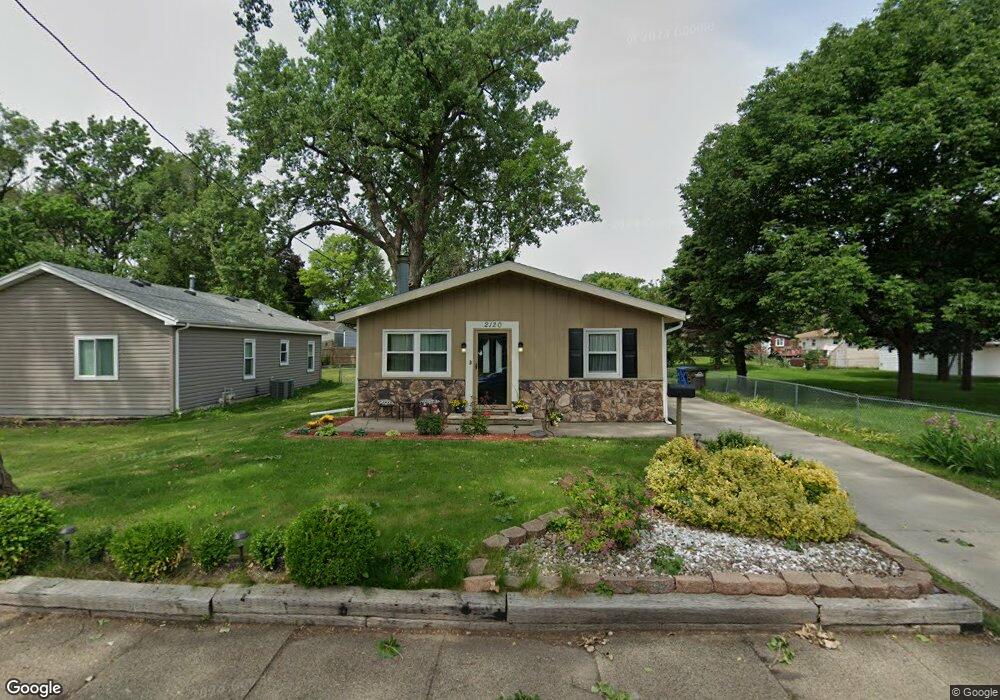
2120 E 25th St Des Moines, IA 50317
Fairmont Park NeighborhoodEstimated Value: $174,000 - $185,000
2
Beds
1
Bath
1,195
Sq Ft
$150/Sq Ft
Est. Value
About This Home
This home is located at 2120 E 25th St, Des Moines, IA 50317 and is currently estimated at $178,959, approximately $149 per square foot. 2120 E 25th St is a home located in Polk County with nearby schools including Phillips Elementary, Goodrell Middle School, and North High School.
Ownership History
Date
Name
Owned For
Owner Type
Purchase Details
Closed on
May 10, 2010
Sold by
Baker Robert J and Baker Emily M
Bought by
Jones Lisa and Jones Jonathan
Current Estimated Value
Home Financials for this Owner
Home Financials are based on the most recent Mortgage that was taken out on this home.
Original Mortgage
$98,572
Outstanding Balance
$67,257
Interest Rate
5.5%
Mortgage Type
FHA
Estimated Equity
$111,702
Purchase Details
Closed on
Jan 9, 2006
Sold by
Centex Home Equity Co Llc
Bought by
Baker Robert J and Baker Emily M
Home Financials for this Owner
Home Financials are based on the most recent Mortgage that was taken out on this home.
Original Mortgage
$88,798
Interest Rate
6.2%
Mortgage Type
FHA
Purchase Details
Closed on
Jun 8, 2005
Sold by
Case Jesse L
Bought by
Centex Home Equity Co Llc
Create a Home Valuation Report for This Property
The Home Valuation Report is an in-depth analysis detailing your home's value as well as a comparison with similar homes in the area
Home Values in the Area
Average Home Value in this Area
Purchase History
| Date | Buyer | Sale Price | Title Company |
|---|---|---|---|
| Jones Lisa | $99,500 | Itc | |
| Baker Robert J | $76,000 | Title Services Corporation | |
| Centex Home Equity Co Llc | -- | -- |
Source: Public Records
Mortgage History
| Date | Status | Borrower | Loan Amount |
|---|---|---|---|
| Open | Jones Lisa | $98,572 | |
| Previous Owner | Baker Robert J | $88,798 |
Source: Public Records
Tax History
| Year | Tax Paid | Tax Assessment Tax Assessment Total Assessment is a certain percentage of the fair market value that is determined by local assessors to be the total taxable value of land and additions on the property. | Land | Improvement |
|---|---|---|---|---|
| 2025 | $2,646 | $165,200 | $23,300 | $141,900 |
| 2024 | $2,646 | $145,000 | $20,200 | $124,800 |
| 2023 | $2,418 | $145,000 | $20,200 | $124,800 |
| 2022 | $2,398 | $111,500 | $16,000 | $95,500 |
| 2021 | $2,256 | $111,500 | $16,000 | $95,500 |
| 2020 | $2,338 | $99,000 | $14,200 | $84,800 |
| 2019 | $2,034 | $99,000 | $14,200 | $84,800 |
| 2018 | $2,008 | $84,200 | $11,700 | $72,500 |
| 2017 | $1,992 | $84,200 | $11,700 | $72,500 |
| 2016 | $1,936 | $82,200 | $11,300 | $70,900 |
| 2015 | $1,936 | $82,200 | $11,300 | $70,900 |
| 2014 | $1,978 | $86,200 | $11,500 | $74,700 |
Source: Public Records
Map
Nearby Homes
- 1821 E 25th St
- 1901 E 23rd St
- 2503 E 24th St
- 2324 E 23rd St
- 2520 E 25th St
- 2700 Hubbell Ave
- 2539 E 23rd St
- 2654 Wisconsin Ave
- 2208 Tichenor St
- 2113 E 21st St
- 2670 Wisconsin Ave
- 2710 E Washington Ave
- 2757 Easton Blvd
- 1924 E 29th St
- 2633 Grandview Ave
- 2612 Grandview Ave
- 2741 E Washington Ave
- 2555 Hull Ave
- 1410 E 23rd St
- 1604 E 29th St
Your Personal Tour Guide
Ask me questions while you tour the home.