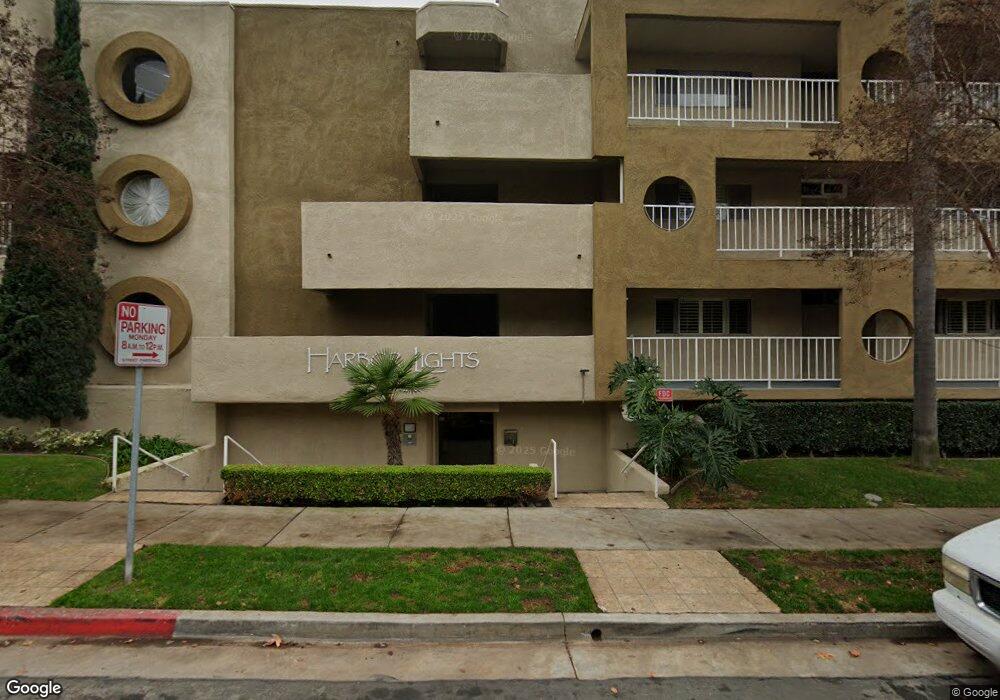
2120 E Hill St Unit 301 Signal Hill, CA 90755
Estimated Value: $619,853 - $751,000
2
Beds
2
Baths
1,318
Sq Ft
$516/Sq Ft
Est. Value
About This Home
This home is located at 2120 E Hill St Unit 301, Signal Hill, CA 90755 and is currently estimated at $680,713, approximately $516 per square foot. 2120 E Hill St Unit 301 is a home located in Los Angeles County with nearby schools including Alvarado Elementary, Nelson Academy, and Woodrow Wilson High School.
Ownership History
Date
Name
Owned For
Owner Type
Purchase Details
Closed on
Mar 22, 2017
Sold by
Miller Gary E
Bought by
Miller Gary E and Miller Teresa Crowe
Current Estimated Value
Purchase Details
Closed on
Feb 1, 2003
Sold by
Crowe Teresa
Bought by
Miller Gary E and Crowe Miller Teresa
Home Financials for this Owner
Home Financials are based on the most recent Mortgage that was taken out on this home.
Original Mortgage
$186,600
Interest Rate
5.93%
Purchase Details
Closed on
Dec 13, 2000
Sold by
Shiller Linda
Bought by
Crowe Teresa and Miller Gary E
Home Financials for this Owner
Home Financials are based on the most recent Mortgage that was taken out on this home.
Original Mortgage
$181,600
Interest Rate
7.41%
Purchase Details
Closed on
May 18, 1999
Sold by
Kullenberg Patrick N
Bought by
Shiller Linda
Home Financials for this Owner
Home Financials are based on the most recent Mortgage that was taken out on this home.
Original Mortgage
$189,000
Interest Rate
7%
Create a Home Valuation Report for This Property
The Home Valuation Report is an in-depth analysis detailing your home's value as well as a comparison with similar homes in the area
Home Values in the Area
Average Home Value in this Area
Purchase History
| Date | Buyer | Sale Price | Title Company |
|---|---|---|---|
| Miller Gary E | -- | None Available | |
| Miller Gary E | -- | American Title | |
| Crowe Teresa | $227,000 | Equity Title | |
| Shiller Linda | $199,000 | Equity Title |
Source: Public Records
Mortgage History
| Date | Status | Borrower | Loan Amount |
|---|---|---|---|
| Closed | Miller Gary E | $186,600 | |
| Closed | Crowe Teresa | $181,600 | |
| Previous Owner | Shiller Linda | $189,000 |
Source: Public Records
Tax History Compared to Growth
Tax History
| Year | Tax Paid | Tax Assessment Tax Assessment Total Assessment is a certain percentage of the fair market value that is determined by local assessors to be the total taxable value of land and additions on the property. | Land | Improvement |
|---|---|---|---|---|
| 2025 | $1,810 | $104,154 | $32,626 | $71,528 |
| 2024 | $1,810 | $102,113 | $31,987 | $70,126 |
| 2023 | $1,781 | $100,111 | $31,360 | $68,751 |
| 2022 | $1,688 | $98,149 | $30,746 | $67,403 |
| 2021 | $1,647 | $96,226 | $30,144 | $66,082 |
| 2019 | $1,624 | $93,373 | $29,250 | $64,123 |
| 2018 | $1,572 | $91,543 | $28,677 | $62,866 |
| 2016 | $1,453 | $87,990 | $27,564 | $60,426 |
| 2015 | $1,410 | $86,669 | $27,150 | $59,519 |
| 2014 | $1,410 | $84,973 | $26,619 | $58,354 |
Source: Public Records
Map
Nearby Homes
- 2231 Saint Louis Ave Unit 101B
- 2240 N Legion Dr Unit 217
- 2298 Rose Ave Unit 110
- 1965 Saint Louis Ave
- 2205 Starlight Ln
- 2238 Walnut Ave
- 2240 Walnut Ave
- 2240 Stanley Ave Unit 5
- 2215 Molino Ave Unit C
- 1988 Junipero Ave
- 1887 Saint Louis Ave
- 1994 Stanley Ave
- 2199 Ohio Ave
- 2420 Gaviota Ave
- 2265 Ohio Ave
- 2430 Gaviota Ave
- 1850 Gardenia Ave
- 1845 Dawson Ave
- 2150 Ohio Ave Unit E
- 2604 E 20th St Unit 304F
- 2120 E Hill St
- 2120 E Hill St Unit 205
- 2120 E Hill St Unit 107
- 2120 E Hill St Unit 106
- 2120 E Hill St Unit 204
- 2120 E Hill St Unit 302
- 2120 E Hill St Unit 203
- 2120 E Hill St Unit 105
- 2120 E Hill St Unit 104
- 2120 E Hill St Unit 202
- 2120 E Hill St Unit 103
- 2120 E Hill St Unit 102
- 2120 E Hill St Unit 201
- 2120 E Hill St Unit 101
- 2120 E Hill St Unit 309
- 2120 E Hill St Unit 308
- 2120 E Hill St Unit 310
- 2120 E Hill St Unit 307
- 2120 E Hill St Unit 209
- 2120 E Hill St Unit 208