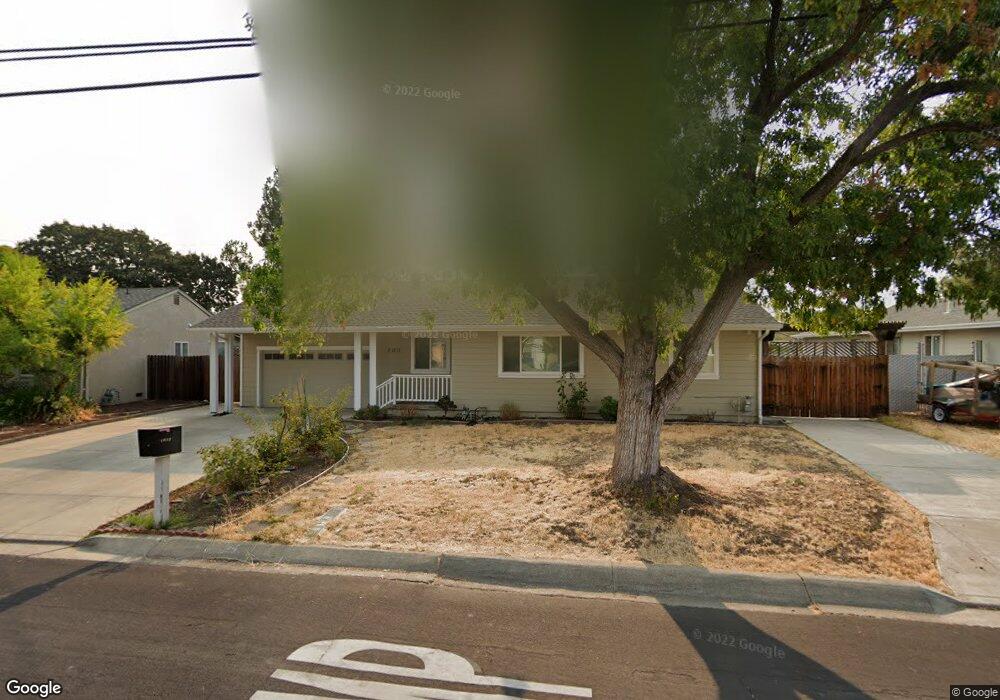
2120 Leland Way Concord, CA 94520
Monument Corridor NeighborhoodEstimated Value: $646,000 - $751,543
3
Beds
3
Baths
1,637
Sq Ft
$427/Sq Ft
Est. Value
About This Home
This home is located at 2120 Leland Way, Concord, CA 94520 and is currently estimated at $698,886, approximately $426 per square foot. 2120 Leland Way is a home located in Contra Costa County with nearby schools including Meadow Homes Elementary School, Oak Grove Middle School, and Mt. Diablo High School.
Ownership History
Date
Name
Owned For
Owner Type
Purchase Details
Closed on
Jun 17, 2011
Sold by
Cheung Connie
Bought by
Cheung Connie Kwong San and Fu Chi Wing
Current Estimated Value
Purchase Details
Closed on
Jun 13, 2011
Sold by
Heald Asa Guy and Heald Joanne Weil
Bought by
Cheung Connie
Purchase Details
Closed on
May 13, 2005
Sold by
Heald Asa Guy and Heald Joanne Weil
Bought by
Heald Asa Guy and Heald Joanne Weil
Purchase Details
Closed on
Mar 1, 2004
Sold by
Heald Asa G
Bought by
Heald Asa Guy and Heald Joanne Weil
Purchase Details
Closed on
Dec 4, 2002
Sold by
Heald Asa G
Bought by
Heald Asa G
Home Financials for this Owner
Home Financials are based on the most recent Mortgage that was taken out on this home.
Original Mortgage
$153,000
Interest Rate
6.28%
Mortgage Type
Purchase Money Mortgage
Create a Home Valuation Report for This Property
The Home Valuation Report is an in-depth analysis detailing your home's value as well as a comparison with similar homes in the area
Home Values in the Area
Average Home Value in this Area
Purchase History
| Date | Buyer | Sale Price | Title Company |
|---|---|---|---|
| Cheung Connie Kwong San | -- | Accommodation | |
| Cheung Connie | $386,000 | Chicago Title Company | |
| Heald Asa Guy | -- | -- | |
| Heald Asa Guy | -- | -- | |
| Heald Asa G | -- | First American Title |
Source: Public Records
Mortgage History
| Date | Status | Borrower | Loan Amount |
|---|---|---|---|
| Previous Owner | Heald Asa G | $153,000 |
Source: Public Records
Tax History Compared to Growth
Tax History
| Year | Tax Paid | Tax Assessment Tax Assessment Total Assessment is a certain percentage of the fair market value that is determined by local assessors to be the total taxable value of land and additions on the property. | Land | Improvement |
|---|---|---|---|---|
| 2025 | $6,298 | $494,522 | $192,170 | $302,352 |
| 2024 | $6,174 | $484,826 | $188,402 | $296,424 |
| 2023 | $6,174 | $475,320 | $184,708 | $290,612 |
| 2022 | $6,085 | $466,001 | $181,087 | $284,914 |
| 2021 | $5,931 | $456,865 | $177,537 | $279,328 |
| 2019 | $5,815 | $443,316 | $172,272 | $271,044 |
| 2018 | $5,592 | $434,625 | $168,895 | $265,730 |
| 2017 | $5,402 | $426,104 | $165,584 | $260,520 |
| 2016 | $5,248 | $417,750 | $162,338 | $255,412 |
| 2015 | $5,182 | $411,476 | $159,900 | $251,576 |
| 2014 | $5,087 | $403,416 | $156,768 | $246,648 |
Source: Public Records
Map
Nearby Homes
- 1241 Pine Creek Way Unit F
- 1990 Sunshine Dr
- 2361 Bedford Rd
- 1439 Toyon Dr
- 2398 Walters Way Unit 6
- 1600 Laguna St Unit C
- 2000 Laguna Cir Unit D
- 1560 Pine St Unit 8
- 2450 Walters Way Unit 2
- 2450 Walters Way Unit 11
- 1520 Detroit Ave
- 2100 Laguna Cir Unit D
- 2600 Laguna Cir Unit G
- 1865 Premier Place
- 1680 Laguna St Unit H
- 2525 Walters Way Unit 19
- 2525 Walters Way Unit 22
- 1700 Laguna St Unit B
- 1133 Meadow Ln Unit 103
- 1133 Meadow Ln Unit 53
- 2110 Leland Way
- 2130 Leland Way
- 2100 Leland Way
- 2140 Leland Way
- 2115 Leland Way
- 2127 Leland Way
- 2105 Leland Way
- 2090 Leland Way
- 2150 Leland Way
- 2141 Leland Way
- 1310 Lexington Rd
- 2155 Leland Way
- 2080 Leland Way
- 2160 Leland Way
- 2171 Sunshine Dr
- 1320 Lexington Rd
- 1301 Lexington Rd
- 2165 Leland Way
- 2075 Leland Way
- 2170 Leland Way