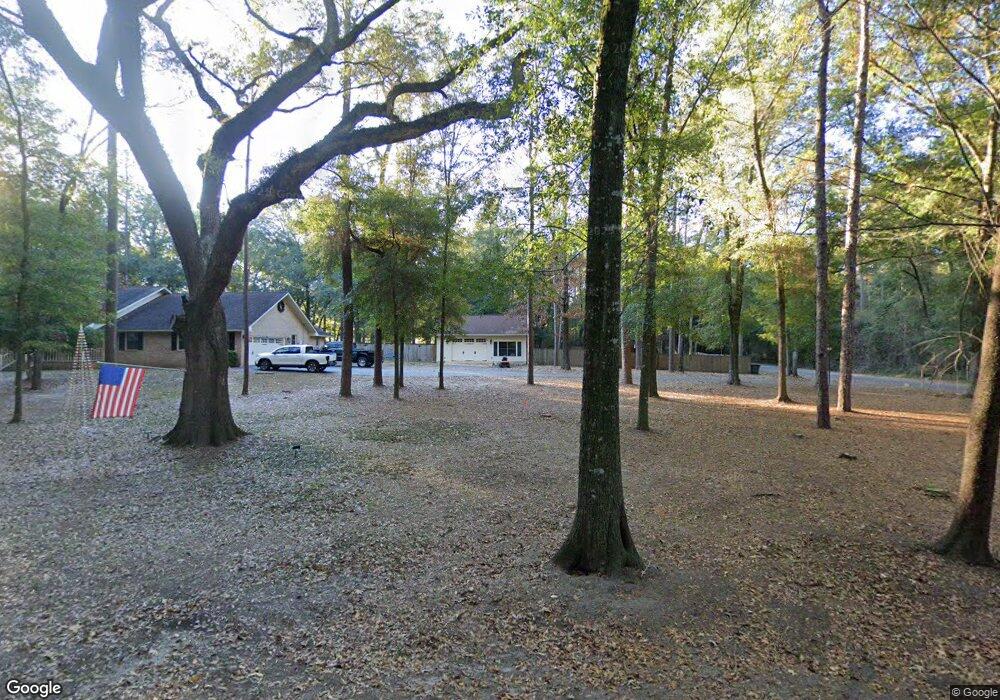
2120 Pilgram Way Bainbridge, GA 39819
Estimated Value: $386,000 - $448,000
--
Bed
1
Bath
2,940
Sq Ft
$139/Sq Ft
Est. Value
About This Home
This home is located at 2120 Pilgram Way, Bainbridge, GA 39819 and is currently estimated at $407,829, approximately $138 per square foot. 2120 Pilgram Way is a home located in Decatur County with nearby schools including Bainbridge High School, Spring Creek Charter Academy, and Grace Christian Academy.
Ownership History
Date
Name
Owned For
Owner Type
Purchase Details
Closed on
May 21, 2018
Sold by
Gilliard Ron M
Bought by
Hutchinson Beverly A
Current Estimated Value
Home Financials for this Owner
Home Financials are based on the most recent Mortgage that was taken out on this home.
Original Mortgage
$223,850
Outstanding Balance
$192,193
Interest Rate
4.37%
Mortgage Type
FHA
Estimated Equity
$215,636
Purchase Details
Closed on
Mar 6, 2009
Sold by
Campbell Kenneth
Bought by
Gilliard Ronald M and Gilliard Beth P
Home Financials for this Owner
Home Financials are based on the most recent Mortgage that was taken out on this home.
Original Mortgage
$199,000
Interest Rate
5.15%
Mortgage Type
New Conventional
Purchase Details
Closed on
Jan 4, 2008
Sold by
Walters John P
Bought by
Campbell Kenneth
Home Financials for this Owner
Home Financials are based on the most recent Mortgage that was taken out on this home.
Original Mortgage
$176,000
Interest Rate
6.88%
Mortgage Type
New Conventional
Create a Home Valuation Report for This Property
The Home Valuation Report is an in-depth analysis detailing your home's value as well as a comparison with similar homes in the area
Home Values in the Area
Average Home Value in this Area
Purchase History
| Date | Buyer | Sale Price | Title Company |
|---|---|---|---|
| Hutchinson Beverly A | $280,000 | -- | |
| Gilliard Ronald M | $299,000 | -- | |
| Campbell Kenneth | $220,000 | -- |
Source: Public Records
Mortgage History
| Date | Status | Borrower | Loan Amount |
|---|---|---|---|
| Open | Hutchinson Beverly A | $223,850 | |
| Previous Owner | Gilliard Ronald M | $199,000 | |
| Previous Owner | Campbell Kenneth | $176,000 |
Source: Public Records
Tax History Compared to Growth
Tax History
| Year | Tax Paid | Tax Assessment Tax Assessment Total Assessment is a certain percentage of the fair market value that is determined by local assessors to be the total taxable value of land and additions on the property. | Land | Improvement |
|---|---|---|---|---|
| 2024 | $4,105 | $131,643 | $6,000 | $125,643 |
| 2023 | $3,607 | $131,643 | $6,000 | $125,643 |
| 2022 | $3,817 | $125,535 | $6,000 | $119,535 |
| 2021 | $3,744 | $120,009 | $6,000 | $114,009 |
| 2020 | $3,413 | $103,798 | $6,000 | $97,798 |
| 2019 | $3,510 | $102,783 | $6,300 | $96,483 |
| 2018 | $3,470 | $102,783 | $6,300 | $96,483 |
| 2017 | $3,594 | $102,783 | $6,300 | $96,483 |
| 2016 | $3,534 | $102,783 | $6,300 | $96,483 |
| 2015 | $3,635 | $102,783 | $6,300 | $96,483 |
| 2014 | $3,370 | $102,783 | $6,300 | $96,483 |
| 2013 | -- | $102,782 | $6,300 | $96,482 |
Source: Public Records
Map
Nearby Homes
- 2010 Ashton Way
- 0 Knollwood Cir Unit 10601153
- 186 Turtle Pond Rd
- 1417 College Rd
- 0 Meadow Ridge Dr
- 2107 Hughes St
- 2219 Wyndham Way
- 1901 Douglas Dr
- 206 Plum Nelly Cir
- 1600 Dogwood Dr
- 2451 Lake Douglas Rd
- 1715 Douglas Dr
- 1606 Twin Lakes Dr
- 1604 Twin Lakes Dr
- 1602 Twin Lakes Dr
- 1511 Woodland Dr
- 1504 Woodland Dr
- 1512 Douglas Dr
- 1000 E Gate Dr
- 290 Long Rd
- 2082 Pilgram Way
- 647 Randolph Ct
- 2135 Pilgram Way
- 642 Randolph Ct
- 2122 Wildhack Rd
- 2123 Wildhack Rd
- 640 Randolph Ct
- 2124 Wildhack Rd
- 641 Randolph Ct
- 645 Randolph Ct
- 636 Randolph Ct
- 639 Randolph Ct
- 2076 Pilgram Way
- 637 Randolph Ct
- 635 Randolph Ct
- 632 Randolph Ct
- 2104 Wildhack Rd
- 2070 Pilgram Way
- 2160 Wildhack Rd
- 2140 Wildhack Rd