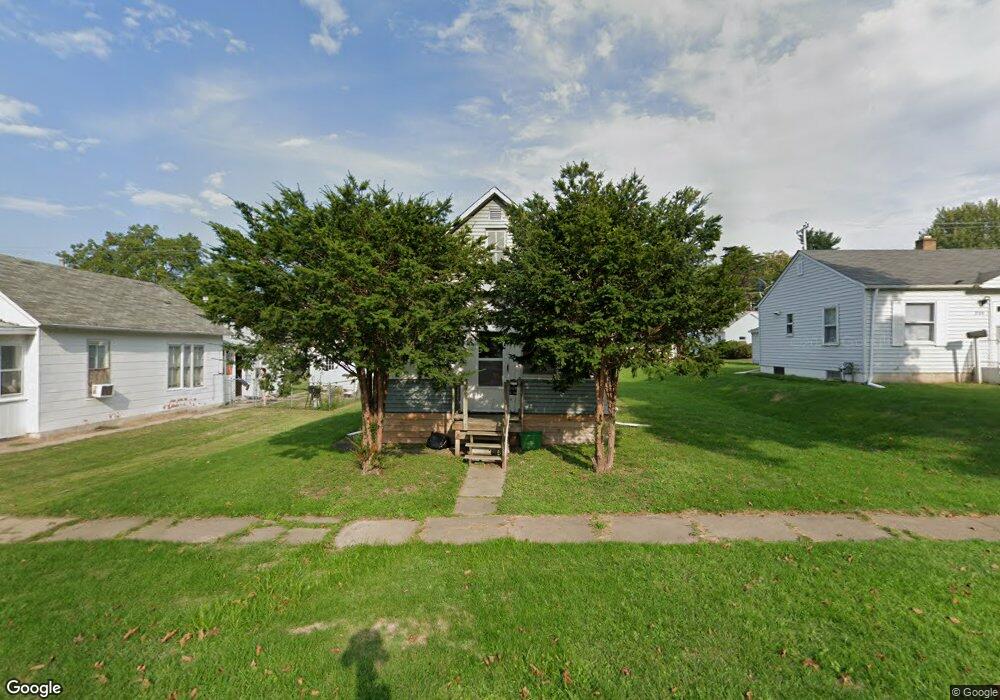
2120 S 3rd St Burlington, IA 52601
Estimated Value: $57,000 - $93,000
2
Beds
1
Bath
779
Sq Ft
$98/Sq Ft
Est. Value
About This Home
This home is located at 2120 S 3rd St, Burlington, IA 52601 and is currently estimated at $76,571, approximately $98 per square foot. 2120 S 3rd St is a home located in Des Moines County with nearby schools including Burlington Community High School, Great River Christian School, and Burlington Notre Dame Catholic Elementary School.
Ownership History
Date
Name
Owned For
Owner Type
Purchase Details
Closed on
Jan 11, 2012
Sold by
Petersen Kenneth R and Petersen Dianne L
Bought by
Petersen Dianne L
Current Estimated Value
Purchase Details
Closed on
Oct 30, 2009
Sold by
Dunn Gregg
Bought by
Petersen Kenneth R and Petersen Dianne L
Home Financials for this Owner
Home Financials are based on the most recent Mortgage that was taken out on this home.
Original Mortgage
$30,258
Interest Rate
6.25%
Mortgage Type
Future Advance Clause Open End Mortgage
Purchase Details
Closed on
Dec 1, 2005
Sold by
Dodge James L and Dodge Carol A
Bought by
Dunn Gregg
Create a Home Valuation Report for This Property
The Home Valuation Report is an in-depth analysis detailing your home's value as well as a comparison with similar homes in the area
Home Values in the Area
Average Home Value in this Area
Purchase History
| Date | Buyer | Sale Price | Title Company |
|---|---|---|---|
| Petersen Dianne L | -- | None Available | |
| Petersen Kenneth R | $30,000 | None Available | |
| Dunn Gregg | $16,000 | None Available |
Source: Public Records
Mortgage History
| Date | Status | Borrower | Loan Amount |
|---|---|---|---|
| Previous Owner | Petersen Kenneth R | $30,258 |
Source: Public Records
Tax History Compared to Growth
Tax History
| Year | Tax Paid | Tax Assessment Tax Assessment Total Assessment is a certain percentage of the fair market value that is determined by local assessors to be the total taxable value of land and additions on the property. | Land | Improvement |
|---|---|---|---|---|
| 2025 | $942 | $54,900 | $7,900 | $47,000 |
| 2024 | $942 | $48,500 | $7,900 | $40,600 |
| 2023 | $824 | $48,500 | $7,900 | $40,600 |
| 2022 | $770 | $37,800 | $7,900 | $29,900 |
| 2021 | $770 | $37,800 | $7,900 | $29,900 |
| 2020 | $820 | $37,800 | $7,900 | $29,900 |
| 2019 | $690 | $37,800 | $7,900 | $29,900 |
| 2018 | $692 | $30,000 | $7,400 | $22,600 |
| 2017 | $692 | $29,200 | $0 | $0 |
| 2016 | $664 | $29,200 | $0 | $0 |
| 2015 | $664 | $29,200 | $0 | $0 |
| 2014 | $674 | $29,800 | $0 | $0 |
Source: Public Records
Map
Nearby Homes