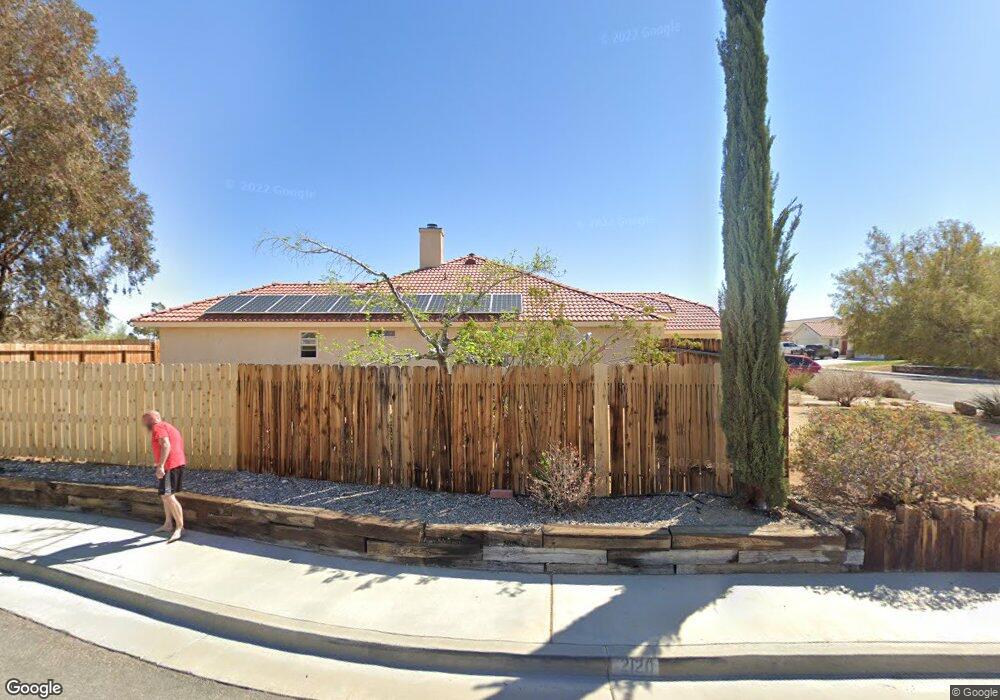
2120 S El Hogar Ridgecrest, CA 93555
Estimated Value: $368,162 - $398,000
3
Beds
2
Baths
1,697
Sq Ft
$224/Sq Ft
Est. Value
About This Home
This home is located at 2120 S El Hogar, Ridgecrest, CA 93555 and is currently estimated at $380,791, approximately $224 per square foot. 2120 S El Hogar is a home located in Kern County with nearby schools including Faller Elementary School, Murray Middle School, and Burroughs High School.
Ownership History
Date
Name
Owned For
Owner Type
Purchase Details
Closed on
May 7, 2023
Sold by
Perry Rodney and Perry Veronica
Bought by
Ledadom Samuel S and Ledadom Molly K
Current Estimated Value
Home Financials for this Owner
Home Financials are based on the most recent Mortgage that was taken out on this home.
Original Mortgage
$199,000
Outstanding Balance
$193,467
Interest Rate
6.39%
Mortgage Type
VA
Estimated Equity
$187,324
Purchase Details
Closed on
Dec 14, 2021
Sold by
Goriesky Daniel B and Goriesky Amy
Bought by
Perry Rodney and Perry Veronica
Home Financials for this Owner
Home Financials are based on the most recent Mortgage that was taken out on this home.
Original Mortgage
$187,800
Interest Rate
3.05%
Mortgage Type
New Conventional
Create a Home Valuation Report for This Property
The Home Valuation Report is an in-depth analysis detailing your home's value as well as a comparison with similar homes in the area
Home Values in the Area
Average Home Value in this Area
Purchase History
| Date | Buyer | Sale Price | Title Company |
|---|---|---|---|
| Ledadom Samuel S | $349,000 | Chicago Title Company | |
| Perry Rodney | $313,000 | First American Title |
Source: Public Records
Mortgage History
| Date | Status | Borrower | Loan Amount |
|---|---|---|---|
| Open | Ledadom Samuel S | $199,000 | |
| Previous Owner | Perry Rodney | $187,800 |
Source: Public Records
Tax History Compared to Growth
Tax History
| Year | Tax Paid | Tax Assessment Tax Assessment Total Assessment is a certain percentage of the fair market value that is determined by local assessors to be the total taxable value of land and additions on the property. | Land | Improvement |
|---|---|---|---|---|
| 2025 | $4,400 | $363,099 | $52,020 | $311,079 |
| 2024 | $3,942 | $355,980 | $51,000 | $304,980 |
| 2023 | $3,942 | $319,260 | $66,300 | $252,960 |
| 2022 | $2,618 | $191,541 | $34,656 | $156,885 |
| 2021 | $2,542 | $187,786 | $33,977 | $153,809 |
| 2020 | $2,542 | $185,861 | $33,629 | $152,232 |
| 2019 | $2,445 | $185,861 | $33,629 | $152,232 |
| 2018 | $2,400 | $178,646 | $32,324 | $146,322 |
| 2017 | $2,393 | $175,144 | $31,691 | $143,453 |
| 2016 | $2,300 | $171,711 | $31,070 | $140,641 |
| 2015 | $2,267 | $169,133 | $30,604 | $138,529 |
| 2014 | $2,115 | $165,821 | $30,005 | $135,816 |
Source: Public Records
Map
Nearby Homes
- 0 Drummond Ave Unit 2606997
- 104 Majestic Sky Ct
- 400 W Vanessa Ave
- 2324 S Desert Cassia St
- 401 W Shenandoah Ave
- 0 W Springer Ave Unit 343-13 2606901
- 0 W Springer Ave Unit IG25046153
- 125 W Franklin Ave
- 343-352-56 Gemstone St
- 104 Rancho Del Cerro
- 647 E Springer Ave
- 133 W Rancho Del Cerro
- 081-025-18 China Lake
- 1205 E Dolphin Ave
- 0 S Downs St
- 1453 S Greenlawn St
- 0 08103122001 W Springer
- 0 Southern Way
- 930 W Franklin Ave
- 843 Sky Place
- 0 W Paseo Airosa Ave
- 120 W Paseo Airosa Ave
- 200 W Via Alegre Unit A
- 2124 S El Hogar
- 2117 S El Hogar
- 2121 S El Hogar Unit A
- 2125 S El Hogar
- 204 W Via Alegre
- 116 W Paseo Airosa Ave
- 2128 S El Hogar
- 2129 S El Hogar
- 208 W Via Alegre
- 121 W Paseo Airosa Ave
- 2116 S Del Rosa Dr
- 2116 S Del Rosa Dr Unit B
- 2116 S Del Rosa Dr Unit A
- 2122 S Del Rosa Dr
- 112 W Paseo Airosa Ave
- 117 W Paseo Airosa Ave
- 201 W Kendall Ave