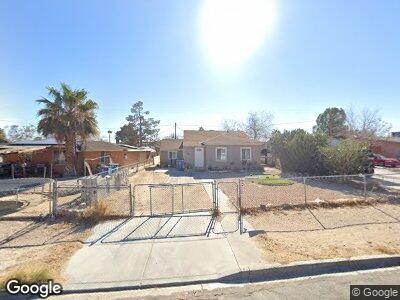
2120 Walnut Ave Las Vegas, NV 89101
Downtown Las Vegas NeighborhoodEstimated Value: $269,513 - $326,000
3
Beds
2
Baths
1,126
Sq Ft
$271/Sq Ft
Est. Value
About This Home
This home is located at 2120 Walnut Ave, Las Vegas, NV 89101 and is currently estimated at $304,878, approximately $270 per square foot. 2120 Walnut Ave is a home located in Clark County with nearby schools including Halle Hewetson Elementary School, J.D. Smith Middle School, and Desert Pines High School.
Ownership History
Date
Name
Owned For
Owner Type
Purchase Details
Closed on
Aug 20, 2019
Sold by
Ruiz Ophelia
Bought by
Ruiz Ophelia and Ruiz Living Trust
Current Estimated Value
Purchase Details
Closed on
Mar 8, 2019
Sold by
Ruiz Ophelia and Garrido Gaston Ruiz
Bought by
Ruiz Ophelia
Purchase Details
Closed on
Jul 10, 2014
Sold by
Burciaga Victor M and Ruiz Ophelia
Bought by
Ruiz Ophelia and Ruiz Garrido Gaston
Purchase Details
Closed on
May 10, 2013
Sold by
Buiciaga Victor M
Bought by
Buiciaga Vitor M and Rella Ophelia
Purchase Details
Closed on
May 28, 2009
Sold by
Buchanan Kathleen and Hembree Michael N
Bought by
Burciaga Victor M
Purchase Details
Closed on
May 22, 2009
Sold by
Garrido Ofelia H Ruiz
Bought by
Burciaga Victor M
Purchase Details
Closed on
Aug 3, 2004
Sold by
Hembree Virginia
Bought by
Hembree Michael
Create a Home Valuation Report for This Property
The Home Valuation Report is an in-depth analysis detailing your home's value as well as a comparison with similar homes in the area
Home Values in the Area
Average Home Value in this Area
Purchase History
| Date | Buyer | Sale Price | Title Company |
|---|---|---|---|
| Ruiz Ophelia | -- | Accommodation | |
| Ruiz Ophelia | -- | None Available | |
| Ruiz Ophelia | $1,000 | None Available | |
| Buiciaga Vitor M | -- | None Available | |
| Burciaga Victor M | $32,000 | Ticor Title Las Vegas | |
| Burciaga Victor M | -- | Ticor Title Las Vegas | |
| Hembree Michael | -- | -- |
Source: Public Records
Mortgage History
| Date | Status | Borrower | Loan Amount |
|---|---|---|---|
| Previous Owner | Burciaga Victor M | $25,000 |
Source: Public Records
Tax History Compared to Growth
Tax History
| Year | Tax Paid | Tax Assessment Tax Assessment Total Assessment is a certain percentage of the fair market value that is determined by local assessors to be the total taxable value of land and additions on the property. | Land | Improvement |
|---|---|---|---|---|
| 2025 | $684 | $40,215 | $24,500 | $15,715 |
| 2024 | $634 | $40,215 | $24,500 | $15,715 |
| 2023 | $634 | $38,770 | $24,500 | $14,270 |
| 2022 | $587 | $33,695 | $21,000 | $12,695 |
| 2021 | $544 | $29,333 | $17,500 | $11,833 |
| 2020 | $502 | $27,248 | $15,750 | $11,498 |
| 2019 | $470 | $23,325 | $12,250 | $11,075 |
| 2018 | $449 | $19,328 | $8,925 | $10,403 |
| 2017 | $613 | $18,709 | $8,400 | $10,309 |
| 2016 | $422 | $16,270 | $6,300 | $9,970 |
| 2015 | $419 | $14,291 | $5,600 | $8,691 |
| 2014 | $406 | $12,213 | $4,200 | $8,013 |
Source: Public Records
Map
Nearby Homes
- 2016 Linden Ave
- 2020 E Bonanza Rd
- 920 E Bonanza Rd
- 1917 Cedar Ave
- 1908 Linden Ave
- 2516 E Mesquite Ave
- 2513 Cedar Ave
- 2410 Poplar Ave
- 1812 Ryan Ave
- 717 N 21st St
- 1701 Linden Ave
- 2600 E Bonanza Rd
- 802 Stewart Ave
- 200 N 18th St
- 1708 Poplar Ave
- 2001 E Mcwilliams Ave
- 424 N 16th St
- 520 N 28th St
- 1905 Stewart Ave
- 237 Cervantes St
- 2120 Walnut Ave
- 2200 Walnut Ave
- 2116 Walnut Ave
- 2204 Walnut Ave
- 2114 Walnut Ave
- 2121 E Mesquite Ave
- 2108 Walnut Ave
- 2208 Walnut Ave
- 424 N 22nd St
- 2201 E Mesquite Ave
- 2117 E Mesquite Ave
- 2205 E Mesquite Ave
- 2113 E Mesquite Ave
- 425 N 22nd St
- 2212 Walnut Ave
- 425 N 23rd St
- 2104 Walnut Ave
- 2209 E Mesquite Ave
- 2109 E Mesquite Ave
- 428 N 22nd St