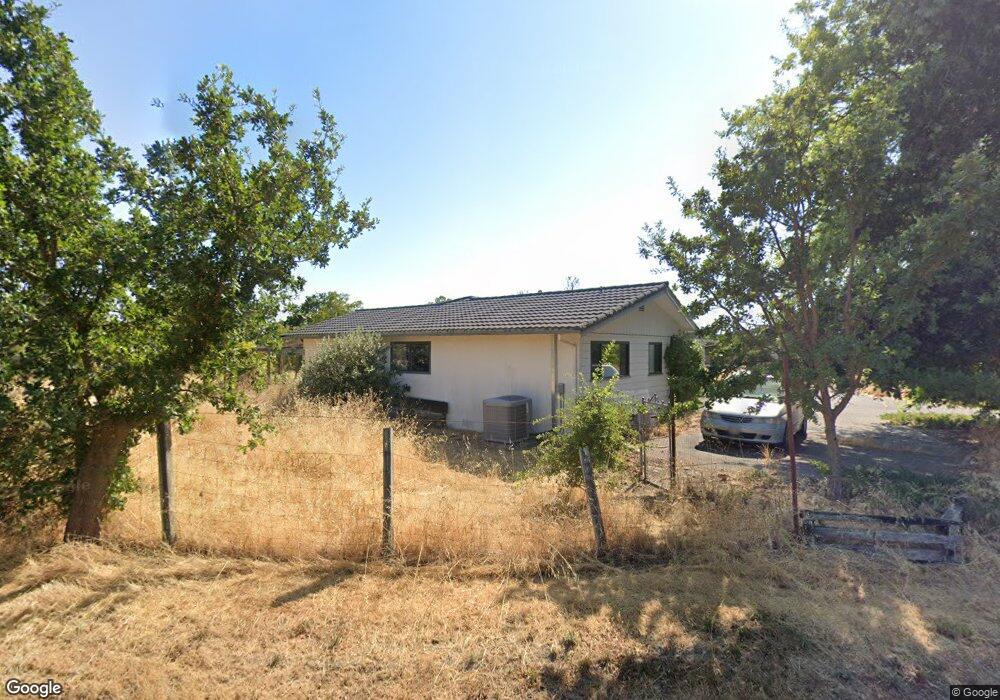
21205 Burndale Rd Sonoma, CA 95476
Estimated Value: $1,076,783 - $1,603,000
3
Beds
2
Baths
1,520
Sq Ft
$900/Sq Ft
Est. Value
About This Home
This home is located at 21205 Burndale Rd, Sonoma, CA 95476 and is currently estimated at $1,368,196, approximately $900 per square foot. 21205 Burndale Rd is a home located in Sonoma County with nearby schools including Prestwood Elementary School, Adele Harrison Middle School, and Creekside High School.
Ownership History
Date
Name
Owned For
Owner Type
Purchase Details
Closed on
Jun 10, 2024
Sold by
Shepard William R and Shepard Wendy J
Bought by
Shepard Trust and Shepard
Current Estimated Value
Purchase Details
Closed on
Sep 16, 1998
Sold by
Shepard William R and Pappas Wendy J
Bought by
Shepard William R and Shepard Wendy J
Home Financials for this Owner
Home Financials are based on the most recent Mortgage that was taken out on this home.
Original Mortgage
$62,000
Interest Rate
6.89%
Mortgage Type
Credit Line Revolving
Purchase Details
Closed on
Dec 8, 1997
Sold by
Camp Cyril L and Camp Karen A
Bought by
Shepard William R and Pappas Wendy L
Home Financials for this Owner
Home Financials are based on the most recent Mortgage that was taken out on this home.
Original Mortgage
$225,000
Interest Rate
7.19%
Create a Home Valuation Report for This Property
The Home Valuation Report is an in-depth analysis detailing your home's value as well as a comparison with similar homes in the area
Home Values in the Area
Average Home Value in this Area
Purchase History
| Date | Buyer | Sale Price | Title Company |
|---|---|---|---|
| Shepard Trust | -- | None Listed On Document | |
| Shepard William R | -- | Fidelity National Title | |
| Shepard William R | $255,000 | First American Title |
Source: Public Records
Mortgage History
| Date | Status | Borrower | Loan Amount |
|---|---|---|---|
| Previous Owner | Shepard William R | $62,000 | |
| Previous Owner | Shepard William R | $225,000 |
Source: Public Records
Tax History
| Year | Tax Paid | Tax Assessment Tax Assessment Total Assessment is a certain percentage of the fair market value that is determined by local assessors to be the total taxable value of land and additions on the property. | Land | Improvement |
|---|---|---|---|---|
| 2025 | $8,738 | $407,153 | $159,666 | $247,487 |
| 2024 | $8,738 | $399,171 | $156,536 | $242,635 |
| 2023 | $8,738 | $391,345 | $153,467 | $237,878 |
| 2022 | $8,517 | $383,672 | $150,458 | $233,214 |
| 2021 | $8,420 | $376,150 | $147,508 | $228,642 |
| 2020 | $8,373 | $372,294 | $145,996 | $226,298 |
| 2019 | $8,280 | $364,995 | $143,134 | $221,861 |
| 2018 | $8,074 | $357,839 | $140,328 | $217,511 |
| 2017 | $4,296 | $350,824 | $137,577 | $213,247 |
| 2016 | $4,031 | $343,946 | $134,880 | $209,066 |
| 2015 | $3,910 | $338,780 | $132,854 | $205,926 |
| 2014 | $3,853 | $332,145 | $130,252 | $201,893 |
Source: Public Records
Map
Nearby Homes
- 21730 Burndale Rd
- 2710 Knob Hill Rd
- 19539 Arrowhead Mountain Rd
- 2034 Fremont Dr
- 21831 Schellville Rd
- 1830 E Napa St
- 8 8th St E
- 20780 8th St E
- 21200 Silva Rd
- 3575 Wood Valley Rd
- 3556 Wood Valley Rd
- 3525 Wood Valley Rd
- 570 E Watmaugh Rd
- 530 Peru Rd
- 22666 Broadway
- 572 Este Madera Dr
- 19450 Old Winery Rd
- 1222 Apple Tree Ct
- 1200 Apple Tree Ct
- 883 Cordilleras Dr
- 21191 Burndale Rd
- 21369 Burndale Rd
- 21250 Burndale Rd
- 21278 Burndale Rd
- 21131 Burndale Rd
- 21001 Allen Rd
- 21432 Burndale Rd
- 21150 Burndale Rd
- 21282 Burndale Rd
- 21117 Burndale Rd
- 21100 Burndale Rd
- 21101 Burndale Rd
- 21040 Peary Ave
- 20950 Burndale Rd
- 21005 Peary Ave
- 21052 Allen Rd
- 20930 Burndale Rd
- 21045 Peary Ave
- 21065 Peary Ave
- 21450 Burndale Rd
Your Personal Tour Guide
Ask me questions while you tour the home.