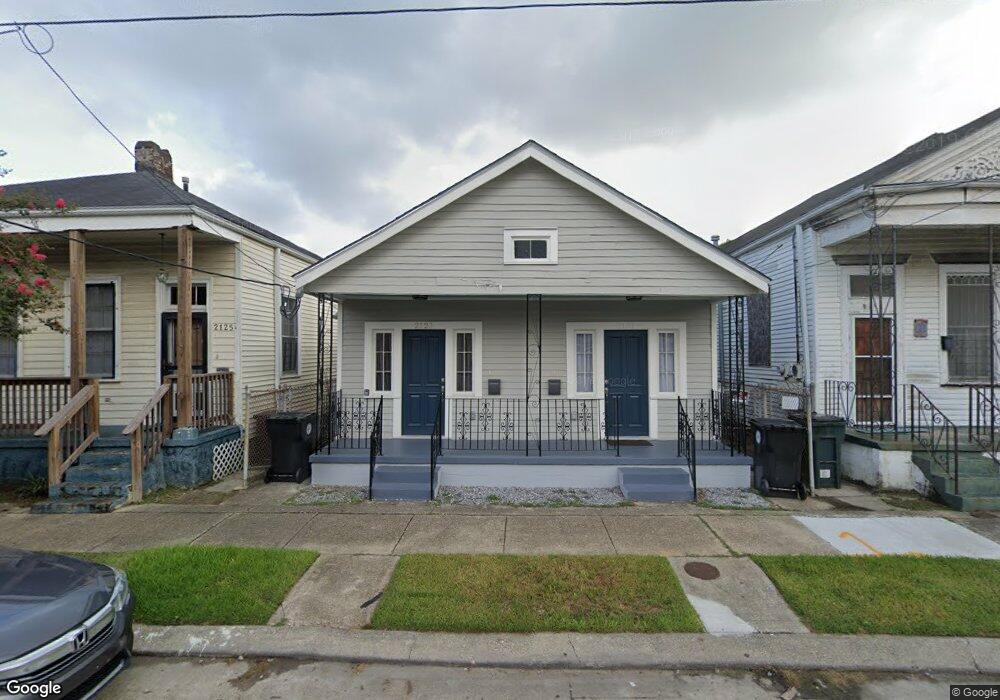
2121 1st St New Orleans, LA 70113
Central City NeighborhoodEstimated Value: $298,000 - $370,000
4
Beds
2
Baths
1,495
Sq Ft
$225/Sq Ft
Est. Value
About This Home
This home is located at 2121 1st St, New Orleans, LA 70113 and is currently estimated at $336,578, approximately $225 per square foot. 2121 1st St is a home located in Orleans Parish with nearby schools including Kipp Central City Academy, Kipp Central City Primary School, and The NET Charter High School.
Ownership History
Date
Name
Owned For
Owner Type
Purchase Details
Closed on
Dec 30, 2021
Sold by
New Orleans Redevelopment Fund 2 Llc
Bought by
Coleman Catrina Rena
Current Estimated Value
Home Financials for this Owner
Home Financials are based on the most recent Mortgage that was taken out on this home.
Original Mortgage
$343,660
Outstanding Balance
$316,726
Interest Rate
3.11%
Mortgage Type
FHA
Estimated Equity
$19,852
Purchase Details
Closed on
May 7, 2018
Sold by
Brown Paul R and Svoboda Marike
Bought by
New Orleans Redevelopment Fund 2 Llc A L
Create a Home Valuation Report for This Property
The Home Valuation Report is an in-depth analysis detailing your home's value as well as a comparison with similar homes in the area
Home Values in the Area
Average Home Value in this Area
Purchase History
| Date | Buyer | Sale Price | Title Company |
|---|---|---|---|
| Coleman Catrina Rena | $350,000 | Desire Title Company | |
| New Orleans Redevelopment Fund 2 Llc A L | $67,000 | Title Management Group Inc |
Source: Public Records
Mortgage History
| Date | Status | Borrower | Loan Amount |
|---|---|---|---|
| Open | Coleman Catrina Rena | $343,660 |
Source: Public Records
Tax History Compared to Growth
Tax History
| Year | Tax Paid | Tax Assessment Tax Assessment Total Assessment is a certain percentage of the fair market value that is determined by local assessors to be the total taxable value of land and additions on the property. | Land | Improvement |
|---|---|---|---|---|
| 2025 | $2,705 | $27,340 | $23,290 | $4,050 |
| 2024 | $3,717 | $27,340 | $23,290 | $4,050 |
| 2023 | $3,388 | $25,200 | $2,700 | $22,500 |
| 2022 | $3,388 | $24,080 | $2,700 | $21,380 |
| 2021 | $3,628 | $25,200 | $2,700 | $22,500 |
| 2020 | $3,664 | $25,200 | $2,700 | $22,500 |
| 2019 | $1,449 | $9,590 | $1,350 | $8,240 |
| 2018 | $1,478 | $9,590 | $1,350 | $8,240 |
| 2017 | $1,411 | $9,590 | $1,350 | $8,240 |
| 2016 | $1,456 | $9,590 | $1,350 | $8,240 |
| 2015 | $1,426 | $9,590 | $1,350 | $8,240 |
| 2014 | -- | $9,590 | $1,350 | $8,240 |
| 2013 | -- | $9,590 | $1,350 | $8,240 |
Source: Public Records
Map
Nearby Homes