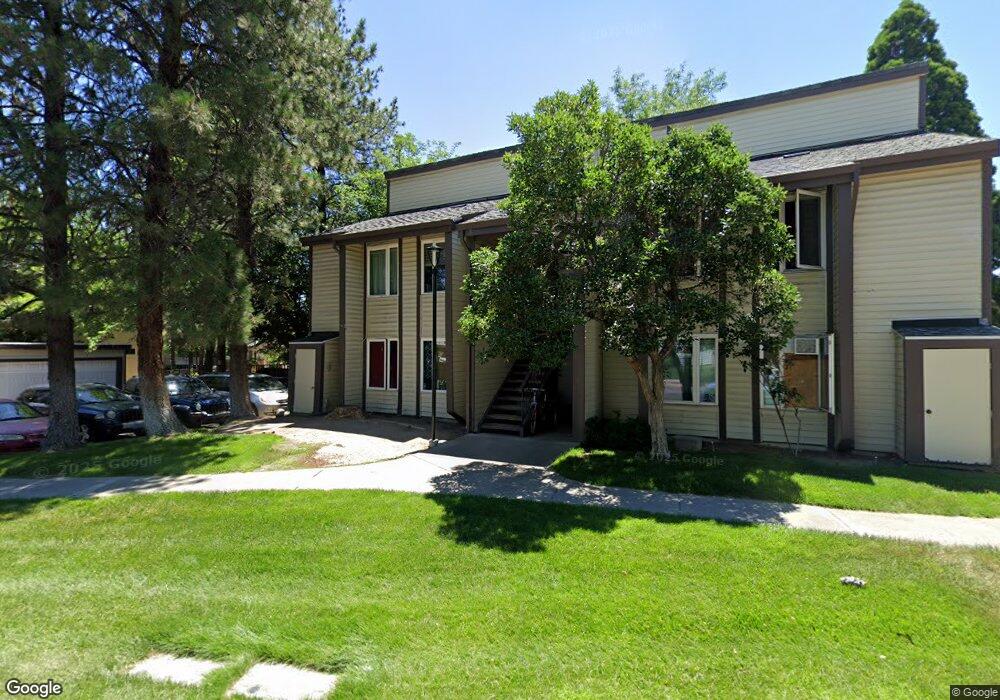
2121 G St Sparks, NV 89431
Downtown Sparks NeighborhoodEstimated Value: $220,000 - $244,000
2
Beds
1
Bath
975
Sq Ft
$236/Sq Ft
Est. Value
About This Home
This home is located at 2121 G St, Sparks, NV 89431 and is currently estimated at $229,712, approximately $235 per square foot. 2121 G St is a home located in Washoe County with nearby schools including Kate M Smith Elementary School, Sparks Middle School, and Sparks High School.
Ownership History
Date
Name
Owned For
Owner Type
Purchase Details
Closed on
Nov 28, 2022
Sold by
Pablo Perez Cornell Revocable Trust
Bought by
Aguilar Armando and Aguilar Josephine
Current Estimated Value
Purchase Details
Closed on
Nov 2, 2022
Sold by
Unknown
Bought by
Pablo Perez Cornell Revocable Trust
Purchase Details
Closed on
Sep 29, 2011
Sold by
Lalor Family Partnership
Bought by
Properties By Legacy Llc
Purchase Details
Closed on
Dec 22, 1999
Sold by
Lalor Harry N and Lalor Diane T
Bought by
Lalor Family Partnership
Purchase Details
Closed on
Sep 27, 1994
Sold by
Beainy Stanley G and Beainy Karen M
Bought by
Lalor Harry N and Lalor Diane T
Home Financials for this Owner
Home Financials are based on the most recent Mortgage that was taken out on this home.
Original Mortgage
$30,000
Interest Rate
6.62%
Create a Home Valuation Report for This Property
The Home Valuation Report is an in-depth analysis detailing your home's value as well as a comparison with similar homes in the area
Home Values in the Area
Average Home Value in this Area
Purchase History
| Date | Buyer | Sale Price | Title Company |
|---|---|---|---|
| Aguilar Armando | $585,000 | First American Title | |
| Pablo Perez Cornell Revocable Trust | -- | -- | |
| Properties By Legacy Llc | $180,000 | Western Title Company | |
| Lalor Family Partnership | -- | -- | |
| Lalor Kevin M | -- | -- | |
| Lalor Harry N | $100,000 | First American Title Company |
Source: Public Records
Mortgage History
| Date | Status | Borrower | Loan Amount |
|---|---|---|---|
| Previous Owner | Lalor Harry N | $30,000 |
Source: Public Records
Tax History Compared to Growth
Tax History
| Year | Tax Paid | Tax Assessment Tax Assessment Total Assessment is a certain percentage of the fair market value that is determined by local assessors to be the total taxable value of land and additions on the property. | Land | Improvement |
|---|---|---|---|---|
| 2025 | $644 | $34,924 | $16,835 | $18,089 |
| 2024 | $644 | $35,895 | $16,835 | $19,060 |
| 2023 | $601 | $34,698 | $17,535 | $17,163 |
| 2022 | $561 | $28,080 | $13,160 | $14,920 |
| 2021 | $544 | $25,966 | $10,850 | $15,116 |
| 2020 | $507 | $26,311 | $10,850 | $15,461 |
| 2019 | $484 | $25,776 | $10,430 | $15,346 |
| 2018 | $463 | $21,011 | $6,055 | $14,956 |
| 2017 | $451 | $21,002 | $5,950 | $15,052 |
| 2016 | $441 | $20,152 | $4,445 | $15,707 |
| 2015 | $118 | $19,272 | $3,885 | $15,387 |
| 2014 | $428 | $13,171 | $3,080 | $10,091 |
| 2013 | -- | $11,199 | $1,960 | $9,239 |
Source: Public Records
Map
Nearby Homes
- 2136 Roundhouse Rd
- 2002 F St
- 2011 H St
- 2380 Roundhouse Rd
- 2168 Cannonball Rd
- 2335 Roundhouse Rd
- 2385 Pauline Ave
- 1830 C St
- 1756 I St
- 1720 G St
- 234 18th St
- 1889 Merchant St
- 848 Rock Blvd
- 1841 Merchant St
- 1855 Verano Dr
- 1560 Steven Ct Unit 2
- 973 Damon Ln
- 1536 Irene Way
- 1527 Steven Ct
- 1780 Greenbrae Dr
- 2125 G St Unit 14
- 2127 G St
- 2123 G St
- 691 Sullivan Ln
- 2107 G St
- 2107 G St Unit 2107 G
- 2107 G St
- 2103 G St
- 2105 G St
- 2101 G St
- 2124 Roundhouse Rd
- 2116 Roundhouse Rd
- 2130 Roundhouse Rd
- 2122 Roundhouse Rd Unit 1
- 2108 Roundhouse Rd
- 2100 Roundhouse Rd Unit 4
- 2110 Roundhouse Rd Unit 6
- 2102 Roundhouse Rd Unit 2
- 2126 Roundhouse Rd
- 2118 Roundhouse Rd