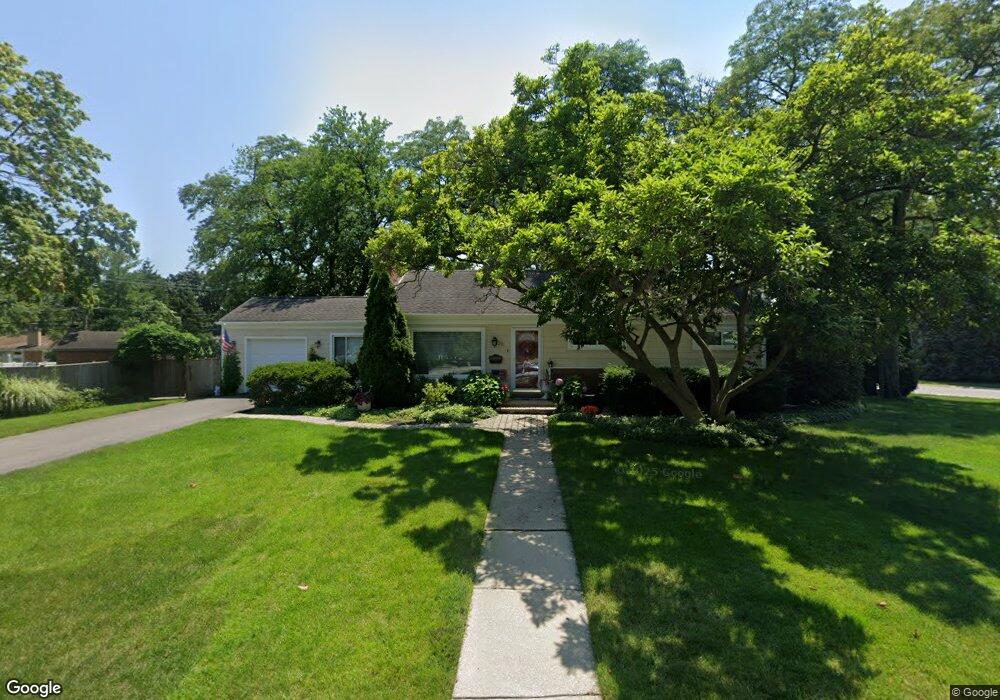
2121 Robincrest Ln Glenview, IL 60025
Estimated Value: $517,304 - $707,000
2
Beds
2
Baths
1,203
Sq Ft
$505/Sq Ft
Est. Value
About This Home
This home is located at 2121 Robincrest Ln, Glenview, IL 60025 and is currently estimated at $607,826, approximately $505 per square foot. 2121 Robincrest Ln is a home located in Cook County with nearby schools including Hoffman Elementary School, Henking Elementary School, and Springman Middle School.
Ownership History
Date
Name
Owned For
Owner Type
Purchase Details
Closed on
Apr 8, 2008
Sold by
Patos Eleni L
Bought by
Patos Eleni L and Eleni Lydia Patos Trust
Current Estimated Value
Purchase Details
Closed on
Jun 7, 2005
Sold by
Patos Demetrios P
Bought by
Patos Eleni L
Home Financials for this Owner
Home Financials are based on the most recent Mortgage that was taken out on this home.
Original Mortgage
$265,000
Outstanding Balance
$135,592
Interest Rate
5.75%
Mortgage Type
New Conventional
Estimated Equity
$472,234
Purchase Details
Closed on
Oct 24, 2000
Sold by
Gloria M Johnson Living Trust
Bought by
Patos Demetrios P and Patos Eleni L
Home Financials for this Owner
Home Financials are based on the most recent Mortgage that was taken out on this home.
Original Mortgage
$252,000
Interest Rate
7.91%
Purchase Details
Closed on
Sep 25, 1998
Sold by
Johnson Gloria M
Bought by
Gloria M Johnson Living Trust
Create a Home Valuation Report for This Property
The Home Valuation Report is an in-depth analysis detailing your home's value as well as a comparison with similar homes in the area
Home Values in the Area
Average Home Value in this Area
Purchase History
| Date | Buyer | Sale Price | Title Company |
|---|---|---|---|
| Patos Eleni L | -- | None Available | |
| Patos Eleni L | -- | 1St American Title | |
| Patos Demetrios P | $280,000 | -- | |
| Gloria M Johnson Living Trust | -- | -- |
Source: Public Records
Mortgage History
| Date | Status | Borrower | Loan Amount |
|---|---|---|---|
| Open | Patos Eleni L | $265,000 | |
| Previous Owner | Patos Demetrios P | $252,000 |
Source: Public Records
Tax History
| Year | Tax Paid | Tax Assessment Tax Assessment Total Assessment is a certain percentage of the fair market value that is determined by local assessors to be the total taxable value of land and additions on the property. | Land | Improvement |
|---|---|---|---|---|
| 2025 | $7,406 | $51,000 | $18,852 | $32,148 |
| 2024 | $7,406 | $36,776 | $15,875 | $20,901 |
| 2023 | $7,174 | $36,776 | $15,875 | $20,901 |
| 2022 | $7,174 | $36,776 | $15,875 | $20,901 |
| 2021 | $6,729 | $30,367 | $12,154 | $18,213 |
| 2020 | $7,129 | $32,090 | $12,154 | $19,936 |
| 2019 | $6,640 | $35,264 | $12,154 | $23,110 |
| 2018 | $6,123 | $30,058 | $10,666 | $19,392 |
| 2017 | $6,442 | $32,152 | $10,666 | $21,486 |
| 2016 | $7,011 | $35,640 | $10,666 | $24,974 |
| 2015 | $5,897 | $27,388 | $8,681 | $18,707 |
| 2014 | $5,802 | $27,388 | $8,681 | $18,707 |
| 2013 | $5,612 | $27,388 | $8,681 | $18,707 |
Source: Public Records
Map
Nearby Homes
- 2009 Robincrest Ln
- 517 Briarhill Ln
- 440 Briarhill Rd
- 2537 Pick Dr
- 245 Nora Ave
- 1800 Dewes St Unit 202
- 1800 Dewes St Unit 201
- 2238 Prairie St
- 706 Waukegan Rd Unit 4
- 1735 Longvalley Rd
- 609 Carriage Hill Dr
- 711 Carriage Hill Dr
- 38 Washington St
- 137 Julie Dr
- 2700 Fontana Dr
- 216 Flora Ave
- 1220 Depot St Unit 305
- 1220 Depot St Unit 109
- 1220 Depot St Unit 409
- 2821 Covert Rd
- 615 Spruce St
- 2115 Robincrest Ln
- 2120 Robincrest Ln
- 2135 Robincrest Ln
- 601 Spruce St
- 2111 Robincrest Ln
- 2122 Central Rd
- 2130 Robincrest Ln
- 616 Spruce St
- 2116 Central Rd
- 630 Garden Ct
- 612 Spruce St
- 600 Spruce St
- 2105 Robincrest Ln
- 2110 Central Rd Unit 5
- 2141 Robincrest Ln
- 634 Garden Ct
- 2132 Robincrest Ln
- 2144 Central Rd
- 2104 Central Rd
Your Personal Tour Guide
Ask me questions while you tour the home.