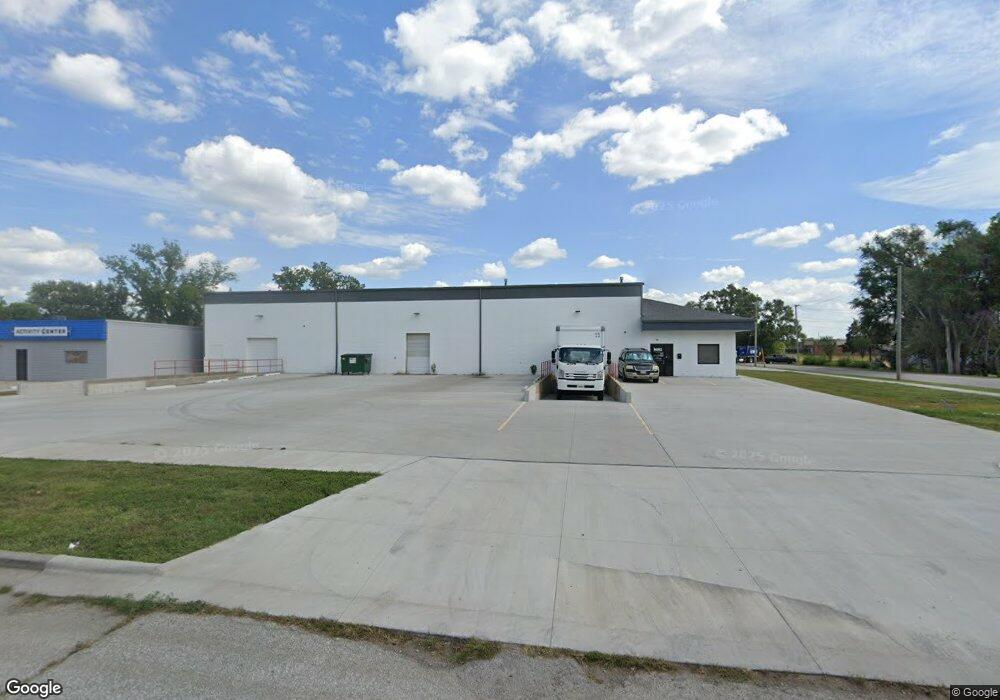
2121 S 7th St Council Bluffs, IA 51501
The South End NeighborhoodEstimated Value: $1,276,059
--
Bed
--
Bath
26,732
Sq Ft
$48/Sq Ft
Est. Value
About This Home
This home is located at 2121 S 7th St, Council Bluffs, IA 51501 and is currently estimated at $1,276,059, approximately $47 per square foot. 2121 S 7th St is a home located in Pottawattamie County with nearby schools including Longfellow Elementary School, Gerald W. Kirn Middle School, and Abraham Lincoln High School.
Ownership History
Date
Name
Owned For
Owner Type
Purchase Details
Closed on
Jun 25, 2021
Sold by
Madsen Kristi D and Dick Douglas A
Bought by
Nationwode Surplus Holdings Llc
Current Estimated Value
Home Financials for this Owner
Home Financials are based on the most recent Mortgage that was taken out on this home.
Original Mortgage
$800,000
Outstanding Balance
$725,876
Interest Rate
2.9%
Mortgage Type
Future Advance Clause Open End Mortgage
Estimated Equity
$550,183
Create a Home Valuation Report for This Property
The Home Valuation Report is an in-depth analysis detailing your home's value as well as a comparison with similar homes in the area
Home Values in the Area
Average Home Value in this Area
Purchase History
| Date | Buyer | Sale Price | Title Company |
|---|---|---|---|
| Nationwode Surplus Holdings Llc | $1,000,000 | None Available |
Source: Public Records
Mortgage History
| Date | Status | Borrower | Loan Amount |
|---|---|---|---|
| Open | Nationwode Surplus Holdings Llc | $800,000 |
Source: Public Records
Tax History Compared to Growth
Tax History
| Year | Tax Paid | Tax Assessment Tax Assessment Total Assessment is a certain percentage of the fair market value that is determined by local assessors to be the total taxable value of land and additions on the property. | Land | Improvement |
|---|---|---|---|---|
| 2025 | $49,046 | $1,730,200 | $99,800 | $1,630,400 |
| 2024 | $49,046 | $1,354,300 | $86,800 | $1,267,500 |
| 2023 | $49,620 | $1,354,300 | $86,800 | $1,267,500 |
| 2022 | $37,254 | $954,900 | $86,800 | $868,100 |
| 2021 | $52,803 | $954,900 | $86,800 | $868,100 |
| 2020 | $21,804 | $868,200 | $86,800 | $781,400 |
| 2019 | $21,542 | $622,500 | $86,800 | $535,700 |
| 2018 | $21,640 | $622,500 | $86,800 | $535,700 |
| 2017 | $21,828 | $639,400 | $20,100 | $619,300 |
| 2015 | $21,860 | $639,400 | $20,100 | $619,300 |
| 2014 | $25,782 | $639,400 | $20,100 | $619,300 |
Source: Public Records
Map
Nearby Homes