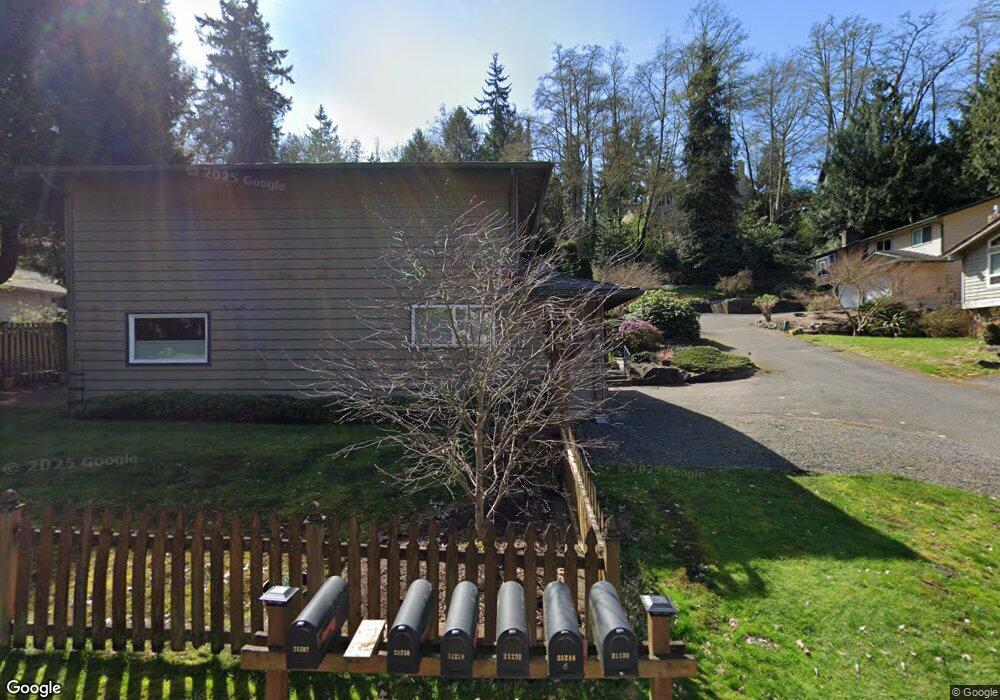
21210 Shell Valley Rd Edmonds, WA 98026
Chase Lake NeighborhoodEstimated Value: $942,414 - $1,042,000
3
Beds
2
Baths
1,886
Sq Ft
$524/Sq Ft
Est. Value
About This Home
This home is located at 21210 Shell Valley Rd, Edmonds, WA 98026 and is currently estimated at $988,104, approximately $523 per square foot. 21210 Shell Valley Rd is a home located in Snohomish County with nearby schools including Chase Lake Elementary School, College Place Middle School, and Edmonds-Woodway High School.
Ownership History
Date
Name
Owned For
Owner Type
Purchase Details
Closed on
Mar 21, 2002
Sold by
Herzer Brett H and Herzer Cheri M
Bought by
Johnson Ronald B and Johnson Christina M
Current Estimated Value
Home Financials for this Owner
Home Financials are based on the most recent Mortgage that was taken out on this home.
Original Mortgage
$234,900
Outstanding Balance
$91,680
Interest Rate
6.85%
Estimated Equity
$896,424
Purchase Details
Closed on
Aug 23, 1995
Sold by
Kirschbaum Cynthia J and Salisbury Cynthia J
Bought by
Herzer Brett H and Herzer Cheri M
Home Financials for this Owner
Home Financials are based on the most recent Mortgage that was taken out on this home.
Original Mortgage
$147,086
Interest Rate
7.5%
Mortgage Type
FHA
Create a Home Valuation Report for This Property
The Home Valuation Report is an in-depth analysis detailing your home's value as well as a comparison with similar homes in the area
Home Values in the Area
Average Home Value in this Area
Purchase History
| Date | Buyer | Sale Price | Title Company |
|---|---|---|---|
| Johnson Ronald B | $261,000 | -- | |
| Herzer Brett H | $149,950 | -- |
Source: Public Records
Mortgage History
| Date | Status | Borrower | Loan Amount |
|---|---|---|---|
| Open | Johnson Ronald B | $234,900 | |
| Previous Owner | Herzer Brett H | $147,086 |
Source: Public Records
Tax History
| Year | Tax Paid | Tax Assessment Tax Assessment Total Assessment is a certain percentage of the fair market value that is determined by local assessors to be the total taxable value of land and additions on the property. | Land | Improvement |
|---|---|---|---|---|
| 2026 | $5,638 | $859,100 | $613,900 | $245,200 |
| 2025 | $5,621 | $800,400 | $567,500 | $232,900 |
| 2024 | $5,621 | $796,300 | $563,400 | $232,900 |
| 2023 | $5,838 | $857,100 | $589,200 | $267,900 |
| 2022 | $5,302 | $640,100 | $435,000 | $205,100 |
| 2020 | $5,039 | $542,300 | $343,000 | $199,300 |
| 2019 | $4,686 | $508,300 | $314,000 | $194,300 |
| 2018 | $4,726 | $442,900 | $269,000 | $173,900 |
| 2017 | $4,023 | $394,900 | $234,000 | $160,900 |
| 2016 | $3,733 | $363,400 | $207,000 | $156,400 |
| 2015 | $3,664 | $335,900 | $194,000 | $141,900 |
| 2013 | $2,769 | $239,600 | $124,000 | $115,600 |
Source: Public Records
Map
Nearby Homes
- 21007 Pioneer Way
- 21522 92nd Ave W
- 8500 Main St Unit F212
- 8608 Main St
- 8503 Bowdoin Way Unit 203
- 21214 96th Ave W
- 9004 218th St SW
- 9325 217th Place SW
- 1021 Walnut St
- 21808 87th Place W
- 8229 212th St SW Unit 102
- 8225 212th St SW Unit 304
- 8225 212th St SW Unit 302
- 8125 212th St SW Unit 9
- 20319 92nd Ave W
- 7522 221st St SW
- 20701 82nd Ave W Unit A
- 20701 82nd Ave W
- 20701 82nd Ave W Unit B
- 21116 80th Ave W Unit 7
- 21130 Shell Valley Rd
- 21214 Shell Valley Rd
- 21126 Shell Valley Rd
- 21218 Shell Valley Rd
- 9017 Park Rd
- 9011 Park Rd
- 21124 Shell Valley Rd
- 21220 Shell Valley Rd
- 21224 Shell Valley Rd
- 9016 Park Rd
- 9021 Park Rd
- 21207 Shell Valley Rd
- 21127 Shell Valley Rd
- 21221 Shell Valley Rd
- 9022 Park Rd
- 21226 Shell Valley Rd
- 21228 Shell Valley Rd
- 21113 Shell Valley Rd
- 9115 Park Rd
- 21225 Shell Valley Rd
Your Personal Tour Guide
Ask me questions while you tour the home.