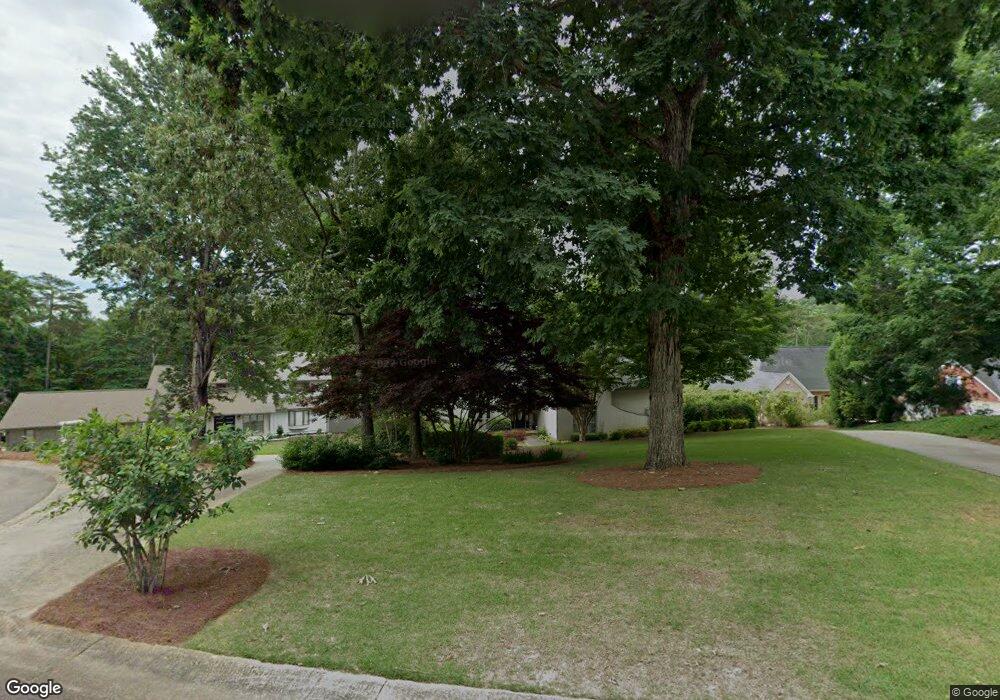
2122 Brittany Ct Gainesville, GA 30506
Estimated Value: $784,000 - $1,289,000
4
Beds
4
Baths
3,864
Sq Ft
$275/Sq Ft
Est. Value
About This Home
This home is located at 2122 Brittany Ct, Gainesville, GA 30506 and is currently estimated at $1,062,891, approximately $275 per square foot. 2122 Brittany Ct is a home located in Hall County with nearby schools including Riverbend Elementary School, North Hall Middle School, and North Hall High School.
Ownership History
Date
Name
Owned For
Owner Type
Purchase Details
Closed on
Jun 27, 2002
Sold by
Knapp Robert P and Knapp Virginia M
Bought by
Harrison James M and Harrison Amy B
Current Estimated Value
Home Financials for this Owner
Home Financials are based on the most recent Mortgage that was taken out on this home.
Original Mortgage
$400,000
Outstanding Balance
$166,410
Interest Rate
6.86%
Mortgage Type
New Conventional
Estimated Equity
$896,481
Purchase Details
Closed on
Apr 13, 2001
Sold by
Knapp Robert P
Bought by
Knapp Robert P and Knapp Virginia M
Home Financials for this Owner
Home Financials are based on the most recent Mortgage that was taken out on this home.
Original Mortgage
$240,000
Interest Rate
7.14%
Mortgage Type
New Conventional
Purchase Details
Closed on
Mar 14, 1997
Sold by
Royer James
Bought by
Bottomley Gary Tonya
Purchase Details
Closed on
Oct 12, 1993
Sold by
Hamrick Ruth H
Bought by
Royer James L and Royer Wanda L
Home Financials for this Owner
Home Financials are based on the most recent Mortgage that was taken out on this home.
Original Mortgage
$56,800
Interest Rate
6.99%
Create a Home Valuation Report for This Property
The Home Valuation Report is an in-depth analysis detailing your home's value as well as a comparison with similar homes in the area
Home Values in the Area
Average Home Value in this Area
Purchase History
| Date | Buyer | Sale Price | Title Company |
|---|---|---|---|
| Harrison James M | $488,000 | -- | |
| Knapp Robert P | -- | -- | |
| Knapp Robert P | $482,500 | -- | |
| Bottomley Gary Tonya | $320,000 | -- | |
| Royer James L | $71,500 | -- |
Source: Public Records
Mortgage History
| Date | Status | Borrower | Loan Amount |
|---|---|---|---|
| Open | Harrison James M | $400,000 | |
| Previous Owner | Knapp Robert P | $240,000 | |
| Previous Owner | Royer James L | $56,800 | |
| Closed | Bottomley Gary Tonya | $0 |
Source: Public Records
Tax History Compared to Growth
Tax History
| Year | Tax Paid | Tax Assessment Tax Assessment Total Assessment is a certain percentage of the fair market value that is determined by local assessors to be the total taxable value of land and additions on the property. | Land | Improvement |
|---|---|---|---|---|
| 2025 | $8,375 | $430,040 | $156,280 | $273,760 |
| 2024 | $8,793 | $351,160 | $128,640 | $222,520 |
| 2023 | $8,161 | $342,080 | $128,640 | $213,440 |
| 2022 | $6,555 | $250,600 | $64,320 | $186,280 |
| 2021 | $6,628 | $248,800 | $64,320 | $184,480 |
| 2020 | $6,633 | $241,880 | $64,320 | $177,560 |
| 2019 | $6,554 | $237,200 | $64,320 | $172,880 |
| 2018 | $6,389 | $223,400 | $56,120 | $167,280 |
| 2017 | $6,220 | $219,760 | $56,120 | $163,640 |
| 2016 | $6,073 | $219,760 | $56,120 | $163,640 |
| 2015 | $5,556 | $219,760 | $56,120 | $163,640 |
| 2014 | $5,556 | $279,160 | $80,120 | $199,040 |
Source: Public Records
Map
Nearby Homes
- 2120 Cleveland Hwy
- 2610 Little River Park Rd
- 2730 Wayman Dr
- 2436 Hawthorne Ln
- 2407 Thompson Mill Rd
- 2152 Silver Cir
- 2533 Bridgewater Dr
- 2432 Thompson Mill Rd
- 2436 Thompson Mill Rd
- 2545 Bridgewater Dr
- 3320 Cleveland Hwy
- 3227 Cleveland Hwy
- 3320 Lakeland Rd
- 2276 Skyline Dr
- 3206 Lakeland Ln
- 2251 Skyline Dr
- 4701A Cleveland Hwy
- 4701A Cleveland Hwy Unit A
- 2501 Katherine Cir
- 3343 Barry Ln
- 2118 Brittany Ct
- 2126 Brittany Ct Unit 7
- 2126 Brittany Ct
- 2114 Brittany Ct
- 2125 Brittany Ct
- 2129 Brittany Ct
- 2130 Brittany Ct
- 2117 Brittany Ct
- 2110 Brittany Ct
- 2107 Brittany Ct
- 2106 Brittany Ct
- 2102 Brittany Ct
- 2610 Pass Cir
- 2124 Cleveland Hwy
- 2602 Pass Cir
- 2616 Pass Cir
- 2618 Pass Cir
- 2141 Cleveland Hwy
- 2122 Cleveland Hwy
- 2143 Cleveland Hwy