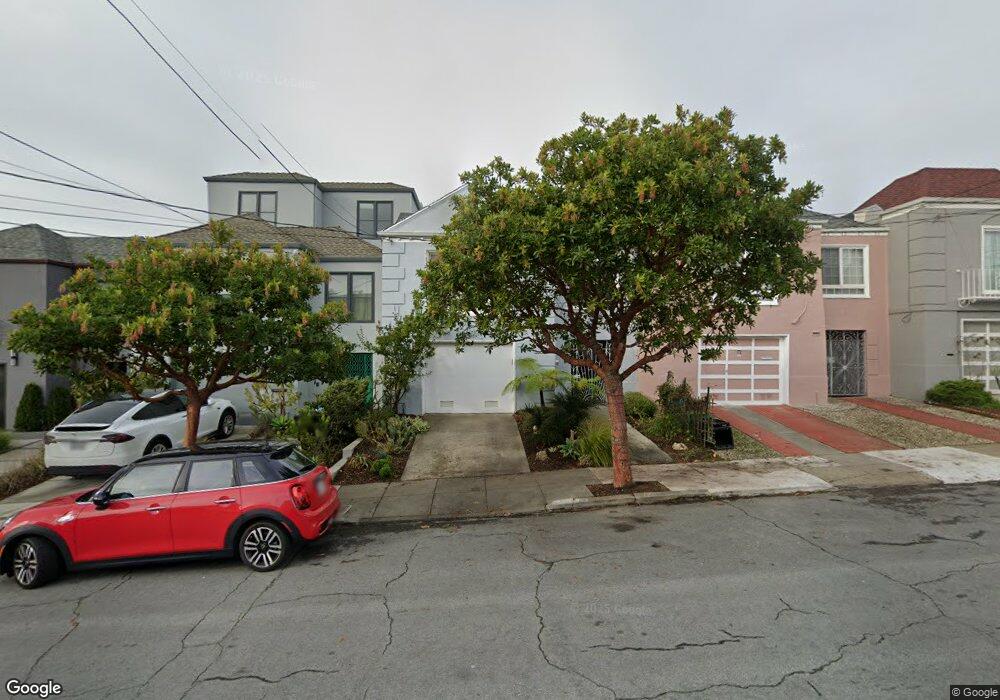
2123 33rd Ave San Francisco, CA 94116
Parkside NeighborhoodEstimated Value: $1,630,000 - $1,810,649
3
Beds
2
Baths
1,657
Sq Ft
$1,030/Sq Ft
Est. Value
About This Home
This home is located at 2123 33rd Ave, San Francisco, CA 94116 and is currently estimated at $1,706,162, approximately $1,029 per square foot. 2123 33rd Ave is a home located in San Francisco County with nearby schools including Stevenson (Robert Louis) Elementary School, Giannini (A.P.) Middle School, and St. Gabriel School.
Ownership History
Date
Name
Owned For
Owner Type
Purchase Details
Closed on
Mar 31, 2014
Sold by
Neil Joe R and Neil Carol L
Bought by
Woods Stephen A and Dicharry Elise N
Current Estimated Value
Home Financials for this Owner
Home Financials are based on the most recent Mortgage that was taken out on this home.
Original Mortgage
$937,500
Outstanding Balance
$711,600
Interest Rate
4.3%
Mortgage Type
New Conventional
Estimated Equity
$994,562
Purchase Details
Closed on
Jan 27, 2005
Sold by
Neil Joe R and Neil Carol L
Bought by
Vanhoff Laura Arden
Purchase Details
Closed on
Aug 25, 2003
Sold by
Cheung Cathy
Bought by
Neil Joe R and Neil Carol L
Home Financials for this Owner
Home Financials are based on the most recent Mortgage that was taken out on this home.
Original Mortgage
$375,000
Interest Rate
5.6%
Mortgage Type
Purchase Money Mortgage
Purchase Details
Closed on
Aug 7, 2001
Sold by
Cheung Cathy and Cheung Ted Tak Yu
Bought by
Cheung Cathy
Home Financials for this Owner
Home Financials are based on the most recent Mortgage that was taken out on this home.
Original Mortgage
$65,000
Interest Rate
7.1%
Mortgage Type
Credit Line Revolving
Purchase Details
Closed on
May 6, 2001
Sold by
Rosabelle Kwan
Bought by
Cheung Cathy and Cheung Ted Tak Yu
Home Financials for this Owner
Home Financials are based on the most recent Mortgage that was taken out on this home.
Original Mortgage
$250,000
Interest Rate
6.89%
Purchase Details
Closed on
Sep 10, 1997
Sold by
Moeslein Family Revocable and Morris D
Bought by
Kwan Rosabelle
Home Financials for this Owner
Home Financials are based on the most recent Mortgage that was taken out on this home.
Original Mortgage
$255,200
Interest Rate
7.45%
Purchase Details
Closed on
Aug 5, 1997
Sold by
Moeslein Family Revocable and James W
Bought by
Bobrow Morris D
Home Financials for this Owner
Home Financials are based on the most recent Mortgage that was taken out on this home.
Original Mortgage
$255,200
Interest Rate
7.45%
Create a Home Valuation Report for This Property
The Home Valuation Report is an in-depth analysis detailing your home's value as well as a comparison with similar homes in the area
Home Values in the Area
Average Home Value in this Area
Purchase History
| Date | Buyer | Sale Price | Title Company |
|---|---|---|---|
| Woods Stephen A | $1,308,000 | Fidelity National Title Co | |
| Vanhoff Laura Arden | -- | None Available | |
| Neil Joe R | $695,000 | Chicago Title Company | |
| Cheung Cathy | -- | Chicago Title Co | |
| Cheung Cathy | $545,000 | Old Republic Title Company | |
| Kwan Rosabelle | $319,000 | North American Title Co | |
| Bobrow Morris D | -- | -- |
Source: Public Records
Mortgage History
| Date | Status | Borrower | Loan Amount |
|---|---|---|---|
| Open | Woods Stephen A | $937,500 | |
| Previous Owner | Neil Joe R | $375,000 | |
| Previous Owner | Cheung Cathy | $65,000 | |
| Previous Owner | Cheung Cathy | $250,000 | |
| Previous Owner | Kwan Rosabelle | $255,200 |
Source: Public Records
Tax History Compared to Growth
Tax History
| Year | Tax Paid | Tax Assessment Tax Assessment Total Assessment is a certain percentage of the fair market value that is determined by local assessors to be the total taxable value of land and additions on the property. | Land | Improvement |
|---|---|---|---|---|
| 2025 | $19,519 | $1,621,510 | $1,122,388 | $499,122 |
| 2024 | $19,519 | $1,589,720 | $1,100,382 | $489,338 |
| 2023 | $19,181 | $1,558,550 | $1,078,806 | $479,744 |
| 2022 | $18,811 | $1,527,994 | $1,057,654 | $470,340 |
| 2021 | $18,480 | $1,498,036 | $1,036,916 | $461,120 |
| 2020 | $18,611 | $1,482,678 | $1,026,284 | $456,394 |
| 2019 | $17,927 | $1,453,608 | $1,006,162 | $447,446 |
| 2018 | $17,324 | $1,425,108 | $986,434 | $438,674 |
| 2017 | $16,823 | $1,397,168 | $967,094 | $430,074 |
| 2016 | $16,376 | $1,354,474 | $948,132 | $406,342 |
| 2015 | $16,175 | $1,334,132 | $933,892 | $400,240 |
| 2014 | $9,856 | $806,075 | $483,645 | $322,430 |
Source: Public Records
Map
Nearby Homes