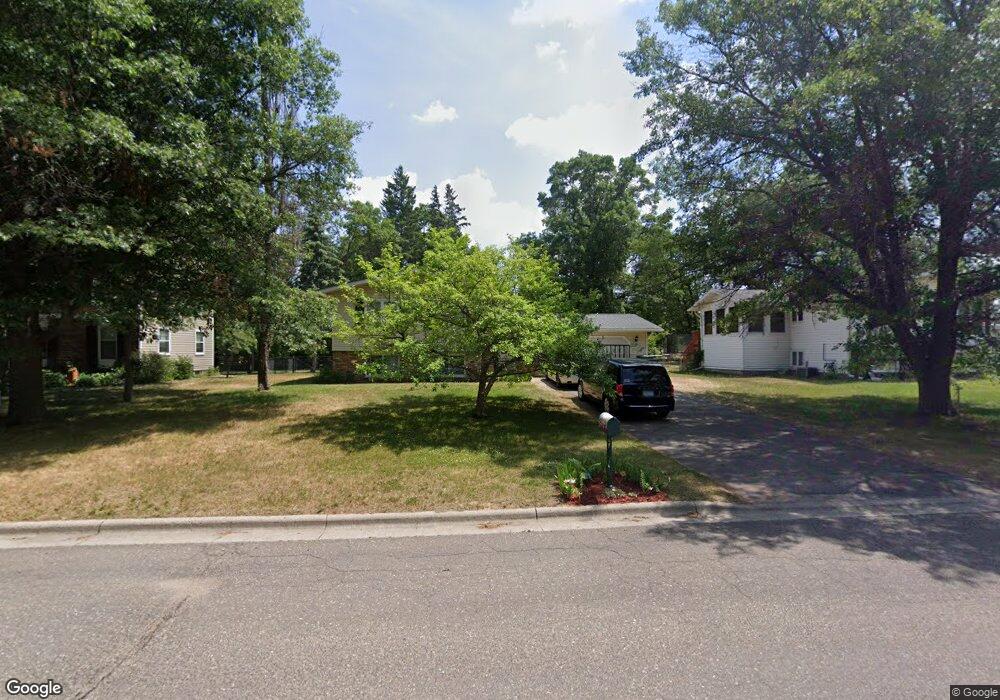
2123 Crestview Ln Brainerd, MN 56401
Estimated Value: $253,000 - $297,000
3
Beds
2
Baths
948
Sq Ft
$291/Sq Ft
Est. Value
About This Home
This home is located at 2123 Crestview Ln, Brainerd, MN 56401 and is currently estimated at $275,873, approximately $291 per square foot. 2123 Crestview Ln is a home located in Crow Wing County with nearby schools including Riverside Elementary School, Forestview Middle School, and Brainerd Senior High School.
Ownership History
Date
Name
Owned For
Owner Type
Purchase Details
Closed on
Apr 28, 2017
Sold by
Johannes Scott Scott
Bought by
Osafo Mamfe and Osafo Andrea
Current Estimated Value
Home Financials for this Owner
Home Financials are based on the most recent Mortgage that was taken out on this home.
Original Mortgage
$147,455
Outstanding Balance
$123,294
Interest Rate
4.3%
Estimated Equity
$152,579
Purchase Details
Closed on
Nov 1, 2007
Sold by
Hoffman Walter L and Hoffman Kim J
Bought by
Johannes Scott W and Johannes Leah J
Purchase Details
Closed on
Apr 1, 2003
Sold by
Welch Michael and Welch Jessica
Bought by
Hoffman Walter and Hoffman Kim
Purchase Details
Closed on
Sep 1, 1998
Sold by
Hayes Betty M
Bought by
Welch Michael A
Purchase Details
Closed on
Aug 1, 1995
Sold by
Meyer David B
Bought by
Hayes Betty M
Create a Home Valuation Report for This Property
The Home Valuation Report is an in-depth analysis detailing your home's value as well as a comparison with similar homes in the area
Home Values in the Area
Average Home Value in this Area
Purchase History
| Date | Buyer | Sale Price | Title Company |
|---|---|---|---|
| Osafo Mamfe | $147,500 | -- | |
| Johannes Scott W | $150,000 | -- | |
| Hoffman Walter | $140,000 | -- | |
| Welch Michael A | $80,000 | -- | |
| Hayes Betty M | $56,000 | -- |
Source: Public Records
Mortgage History
| Date | Status | Borrower | Loan Amount |
|---|---|---|---|
| Open | Osafo Mamfe | $147,455 |
Source: Public Records
Tax History
| Year | Tax Paid | Tax Assessment Tax Assessment Total Assessment is a certain percentage of the fair market value that is determined by local assessors to be the total taxable value of land and additions on the property. | Land | Improvement |
|---|---|---|---|---|
| 2025 | $2,200 | $212,500 | $54,100 | $158,400 |
| 2024 | $2,200 | $221,200 | $49,000 | $172,200 |
| 2023 | $1,950 | $205,700 | $47,300 | $158,400 |
| 2022 | $1,986 | $180,900 | $42,000 | $138,900 |
| 2021 | $1,972 | $152,900 | $38,600 | $114,300 |
| 2020 | $1,784 | $146,500 | $37,700 | $108,800 |
| 2019 | $1,734 | $136,000 | $37,700 | $98,300 |
| 2018 | $1,556 | $132,000 | $37,500 | $94,500 |
| 2017 | $1,342 | $100,972 | $29,862 | $71,110 |
| 2016 | $1,220 | $78,700 | $20,400 | $58,300 |
| 2015 | $1,094 | $70,200 | $16,000 | $54,200 |
| 2014 | $501 | $69,900 | $15,100 | $54,800 |
Source: Public Records
Map
Nearby Homes
- 2514 Greenwood St SW
- 152 Pineview Dr
- 2230 Spruce Dr
- 2242 Spruce Dr
- 11437 Andrew St
- TBD Eagle Ridge
- (Lot 15) 11212 Tabor Trail
- 11312 Arlington Ave
- 1649 S 6th St
- (Lot 14) 11192 Tabor Trail
- (Lot 1) 11205 Tabor Trail
- (Lot 2) 11131) Tabor Trail
- (Lot 3) 11103 Tabor Trail
- (Lot 13) 11170 Tabor Trail
- (Lot 12) 11158 Tabor Trail
- (Lot 4) 11087 Tabor Trail
- (Lot 11) 11138 Tabor Trail
- (Lot 5) 11067 Tabor Trail
- (Lot 10) 11126 Tabor Trail
- (Lot 9) 11096 Tabor Trail
- 2131 Crestview Ln
- 2117 Crestview Ln
- 2134 Graydon Ave
- 2120 Graydon Ave
- 0 Lot 6 Crestview Ln Unit 3536575
- 0 Lot 6 Crestview Ln Unit 4616091
- 2128 Crestview Ln
- 2109 Crestview Ln
- 2120 Crestview Ln
- 2134 Crestview Ln
- 2112 Graydon Ave
- 167 Buffalo Hills Ln W
- 167 Buffalo Hills Ln W
- 2112 Crestview Ln
- 167 Buffalo Hills Ln W
- 2103 Crestview Ln
- 2104 Crestview Ln
- 2302 Crestview Ln
- 2123 Graydon Ave
- 124 Carol Ln
Your Personal Tour Guide
Ask me questions while you tour the home.