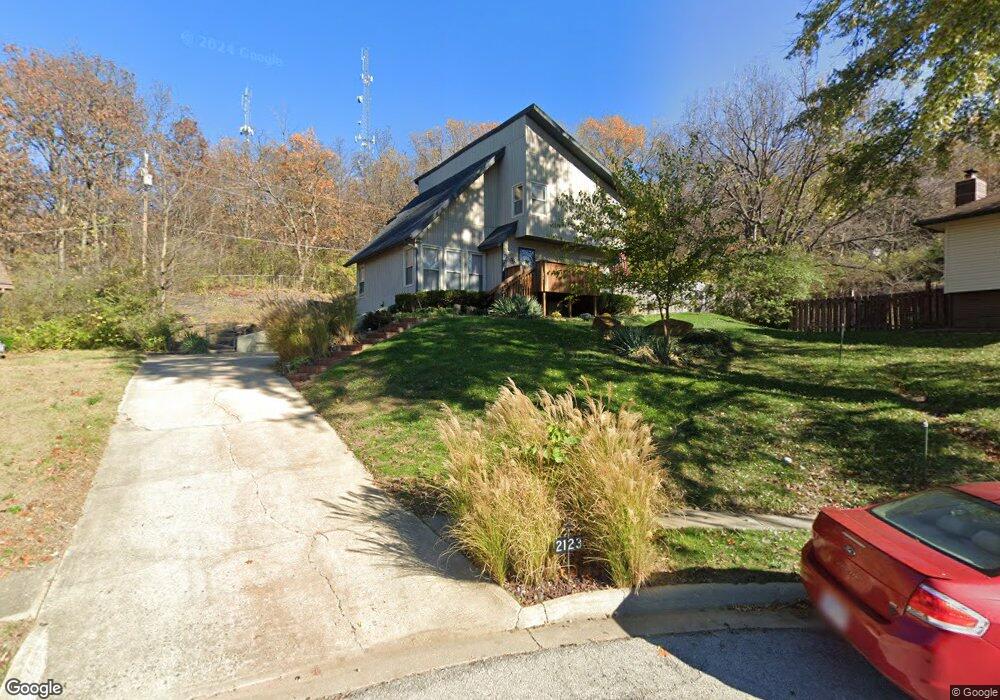
2123 Francis Ct Leavenworth, KS 66048
Estimated Value: $289,000 - $307,000
3
Beds
4
Baths
2,032
Sq Ft
$147/Sq Ft
Est. Value
About This Home
This home is located at 2123 Francis Ct, Leavenworth, KS 66048 and is currently estimated at $298,125, approximately $146 per square foot. 2123 Francis Ct is a home located in Leavenworth County with nearby schools including Henry Leavenworth, Richard Warren Middle School, and Leavenworth Senior High School.
Ownership History
Date
Name
Owned For
Owner Type
Purchase Details
Closed on
Oct 16, 2019
Sold by
Kean Jonella L
Bought by
Burke Patrick N and Burke Rachel M
Current Estimated Value
Purchase Details
Closed on
Jun 1, 2005
Bought by
Burke Patrick N and Burke Rachel M
Home Financials for this Owner
Home Financials are based on the most recent Mortgage that was taken out on this home.
Original Mortgage
$140,514
Interest Rate
5.65%
Mortgage Type
New Conventional
Create a Home Valuation Report for This Property
The Home Valuation Report is an in-depth analysis detailing your home's value as well as a comparison with similar homes in the area
Home Values in the Area
Average Home Value in this Area
Purchase History
| Date | Buyer | Sale Price | Title Company |
|---|---|---|---|
| Burke Patrick N | -- | None Listed On Document | |
| Burke Patrick N | $165,000 | -- |
Source: Public Records
Mortgage History
| Date | Status | Borrower | Loan Amount |
|---|---|---|---|
| Previous Owner | Burke Patrick N | $140,514 |
Source: Public Records
Tax History Compared to Growth
Tax History
| Year | Tax Paid | Tax Assessment Tax Assessment Total Assessment is a certain percentage of the fair market value that is determined by local assessors to be the total taxable value of land and additions on the property. | Land | Improvement |
|---|---|---|---|---|
| 2025 | $3,567 | $31,264 | $2,915 | $28,349 |
| 2024 | $3,538 | $30,353 | $2,915 | $27,438 |
| 2023 | $3,538 | $29,469 | $2,915 | $26,554 |
| 2022 | $3,075 | $25,456 | $3,261 | $22,195 |
| 2021 | $2,850 | $22,193 | $3,261 | $18,932 |
| 2020 | $2,639 | $20,389 | $3,261 | $17,128 |
| 2019 | $2,662 | $20,389 | $3,261 | $17,128 |
| 2018 | $2,577 | $19,577 | $3,271 | $16,306 |
| 2017 | $2,568 | $19,577 | $3,271 | $16,306 |
| 2016 | $2,331 | $17,768 | $3,271 | $14,497 |
| 2015 | $2,354 | $18,044 | $3,271 | $14,773 |
| 2014 | $2,288 | $17,630 | $3,271 | $14,359 |
Source: Public Records
Map
Nearby Homes
- 1316 Vilas St
- 1605 Ridge Rd
- 1601 Holman St
- 1621 Vilas St
- 1715 Klemp St
- 1724 Grand Ave
- 1917 Canterbury Ct
- 1036 Vilas St
- 2021 Vilas St
- 2017 Vilas St
- 2516 Kensington Place
- 3903 S 20th St
- 2510 S 19th Terrace
- 1204 Wildwood St
- 1525 Gatewood St
- 1700 Lawrence Ave
- 1509 10th Ave
- 911 Limit St
- 1420 10th Ave
- 840 Limit St
- 2127 Francis Ct
- 2122 Francis Ct
- 2126 Francis Ct
- 1400 Marion St
- 2131 Francis Ct
- 2130 Francis Ct
- 2123 S 15th St
- 2127 S 15th St
- 2131 S 15th St
- 2200 Sunset Ct
- 2201 Sunset Ct
- 1411 Marion St
- 1415 Marion St
- 1419 Marion St
- 2204 Sunset Ct
- 2124 S 15th St
- 2205 Sunset Ct
- 2205 S 15th St
- 2132 S 15th St
- 2208 Sunset Ct