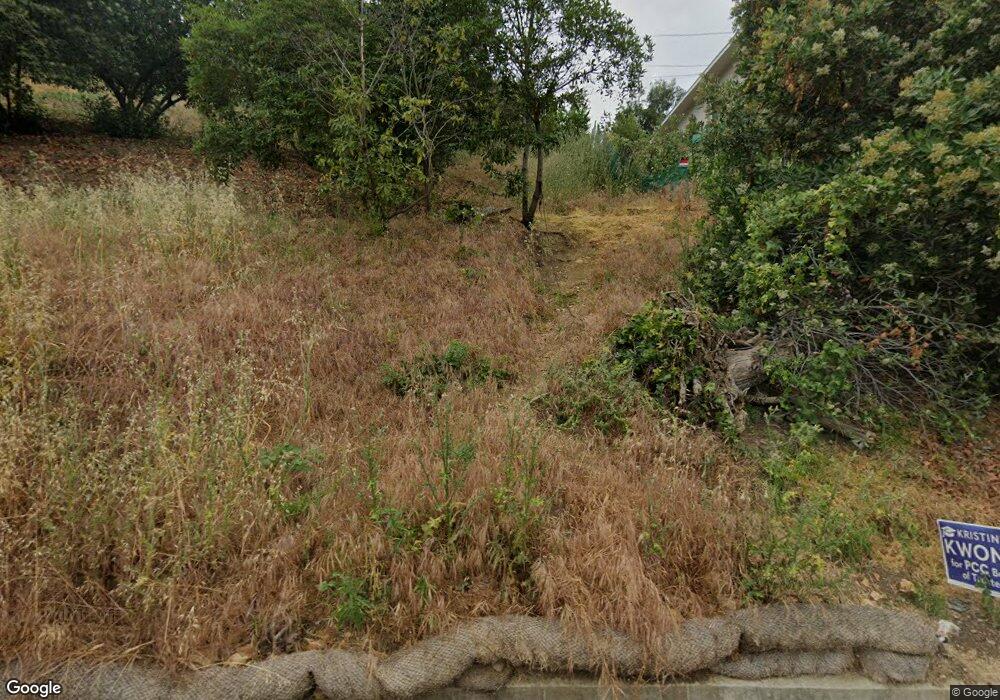
2123 Hanscom Dr South Pasadena, CA 91030
Estimated Value: $361,000 - $382,000
Studio
--
Bath
--
Sq Ft
3,485
Sq Ft Lot
About This Home
This home is located at 2123 Hanscom Dr, South Pasadena, CA 91030 and is currently estimated at $372,998. 2123 Hanscom Dr is a home located in Los Angeles County with nearby schools including Monterey Hills Elementary, South Pasadena Middle School, and South Pasadena High School.
Ownership History
Date
Name
Owned For
Owner Type
Purchase Details
Closed on
Aug 23, 2023
Sold by
Kwong Development Inc
Bought by
Liu Annie and Phi Hong-Thai
Current Estimated Value
Purchase Details
Closed on
Apr 19, 2021
Sold by
Szabadi Jamie
Bought by
Kwong Development Inc
Purchase Details
Closed on
Dec 20, 2016
Sold by
Ohringer Jack F and Szabadi Jamie W
Bought by
Ohringer Jack F and Szabadi Jamie W
Purchase Details
Closed on
Sep 14, 2016
Sold by
Ohringer Jack F and Bogdan Sandor
Bought by
Ohringer Jack F and Szabadi Jamie
Purchase Details
Closed on
Sep 6, 2016
Sold by
Szabadi Jamie
Bought by
Ohringer Jack F
Purchase Details
Closed on
Aug 22, 2016
Sold by
Sopa Hanscom Homes Inc
Bought by
Ohringer Jack F and Bogdan Sandor
Purchase Details
Closed on
Jan 20, 2000
Sold by
Sopa Hanscom Homes
Bought by
Sopa Hanscom Homes Inc
Create a Home Valuation Report for This Property
The Home Valuation Report is an in-depth analysis detailing your home's value as well as a comparison with similar homes in the area
Home Values in the Area
Average Home Value in this Area
Purchase History
| Date | Buyer | Sale Price | Title Company |
|---|---|---|---|
| Liu Annie | $325,000 | Chicago Title Company | |
| Kwong Development Inc | $500,500 | Chicago Title Company | |
| Ohringer Jack F | -- | None Available | |
| Ohringer Jack F | -- | None Available | |
| Ohringer Jack F | -- | Western Resources Title | |
| Ohringer Jack F | $425,000 | Western Resources Title | |
| Sopa Hanscom Homes Inc | -- | -- |
Source: Public Records
Tax History
| Year | Tax Paid | Tax Assessment Tax Assessment Total Assessment is a certain percentage of the fair market value that is determined by local assessors to be the total taxable value of land and additions on the property. | Land | Improvement |
|---|---|---|---|---|
| 2025 | $3,325 | $228,160 | $228,160 | -- |
| 2024 | $3,325 | $223,687 | $223,687 | -- |
| 2023 | $3,249 | $219,301 | $219,301 | $0 |
| 2022 | $3,745 | $215,001 | $215,001 | $0 |
| 2021 | $2,560 | $162,912 | $162,912 | $0 |
| 2020 | $2,523 | $161,242 | $161,242 | $0 |
| 2019 | $2,321 | $158,081 | $158,081 | $0 |
| 2018 | $2,265 | $154,982 | $154,982 | $0 |
| 2016 | $1,652 | $106,662 | $106,662 | $0 |
| 2015 | $1,633 | $105,060 | $105,060 | $0 |
| 2014 | $1,617 | $103,003 | $103,003 | $0 |
Source: Public Records
Map
Nearby Homes
- 2076 Hanscom Dr
- 4648 Harriman Ave
- 4640 Harriman Ave
- 4646 Harriman Ave
- 1836 Peterson Ave
- 1818 Peterson Ave
- 898 Temple Terrace Unit 125
- 809 Temple Terrace
- 127 South Ln
- 0 Hanscom Dr
- 226 Warwick Ave
- 228 Warwick Ave
- 792 Portola Terrace Unit 37
- 4499 Via Marisol Unit 120B
- 4499 Via Marisol Unit 321
- 4499 Via Marisol Unit 240
- 4499 Via Marisol Unit 244C
- 4499 Via Marisol Unit 330
- 4589 Via Marisol Unit 267
- 1231 Blair Ave
- 2121 Hanscom Dr
- 2127 Hanscom Dr
- 2083 Hanscom Dr
- 2131 Hanscom Dr
- 2089 Hanscom Dr
- 149 Peterson Ave
- 2111 Hanscom Dr
- 2093 Hanscom Dr
- 2135 Hanscom Dr
- 2128 Hanscom Dr
- 2077 Hanscom Dr
- 2118 Hanscom Dr
- 2141 Hanscom Dr
- 2084 Hanscom Dr
- 2075 Hanscom Dr
- 2080 Hanscom Dr
- 2130 Hanscom Dr
- 156 Peterson Ave
- 2114 Hanscom Dr
- 2145 Hanscom Dr
Your Personal Tour Guide
Ask me questions while you tour the home.