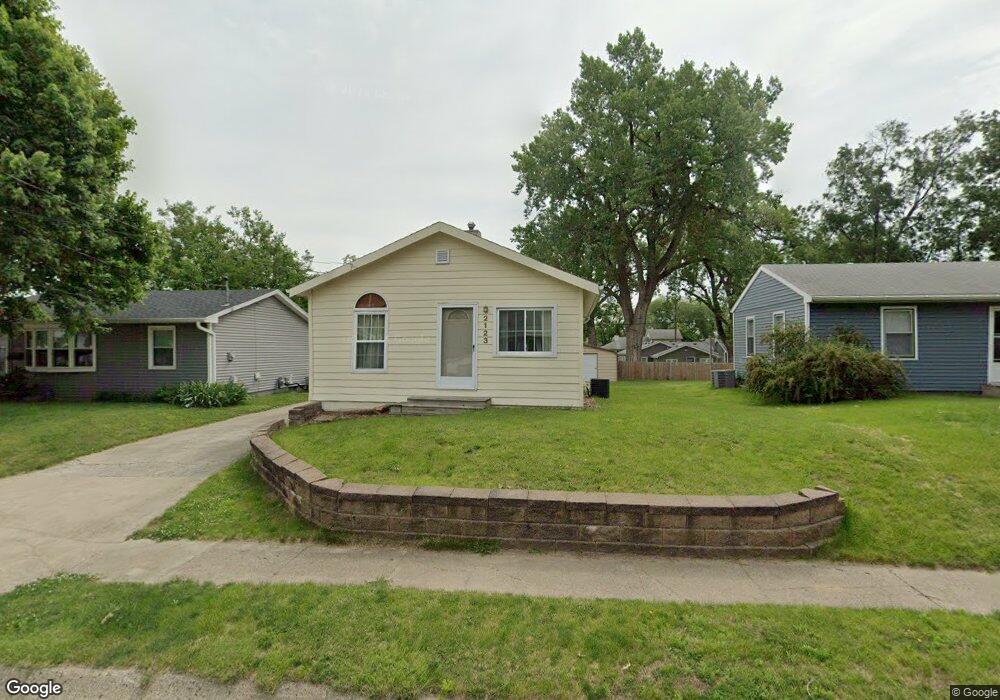
2123 Lay St Des Moines, IA 50317
Fairmont Park NeighborhoodEstimated Value: $142,000 - $161,000
1
Bed
1
Bath
528
Sq Ft
$288/Sq Ft
Est. Value
About This Home
This home is located at 2123 Lay St, Des Moines, IA 50317 and is currently estimated at $152,107, approximately $288 per square foot. 2123 Lay St is a home located in Polk County with nearby schools including Phillips Elementary, Goodrell Middle School, and North High School.
Ownership History
Date
Name
Owned For
Owner Type
Purchase Details
Closed on
Feb 21, 2014
Sold by
Fitzner Terry D and Fitzner Linda K
Bought by
Fitzner Terry D and Fitzner Linda K
Current Estimated Value
Purchase Details
Closed on
Aug 6, 2009
Sold by
Nationstar Mortgage Llc
Bought by
Fitzner Terry D and Fitzner Linda K
Create a Home Valuation Report for This Property
The Home Valuation Report is an in-depth analysis detailing your home's value as well as a comparison with similar homes in the area
Home Values in the Area
Average Home Value in this Area
Purchase History
| Date | Buyer | Sale Price | Title Company |
|---|---|---|---|
| Fitzner Terry D | -- | None Available | |
| Fitzner Terry D | $45,500 | None Available |
Source: Public Records
Tax History Compared to Growth
Tax History
| Year | Tax Paid | Tax Assessment Tax Assessment Total Assessment is a certain percentage of the fair market value that is determined by local assessors to be the total taxable value of land and additions on the property. | Land | Improvement |
|---|---|---|---|---|
| 2025 | $1,638 | $138,600 | $23,300 | $115,300 |
| 2024 | $1,638 | $100,760 | $20,200 | $80,560 |
| 2023 | $1,490 | $122,500 | $20,200 | $102,300 |
| 2022 | $1,476 | $93,800 | $16,000 | $77,800 |
| 2021 | $1,322 | $93,800 | $16,000 | $77,800 |
| 2020 | $1,368 | $83,300 | $14,200 | $69,100 |
| 2019 | $1,308 | $83,300 | $14,200 | $69,100 |
| 2018 | $1,288 | $70,300 | $11,700 | $58,600 |
| 2017 | $1,304 | $70,300 | $11,700 | $58,600 |
| 2016 | $1,266 | $69,100 | $11,300 | $57,800 |
| 2015 | $1,266 | $75,500 | $11,300 | $64,200 |
| 2014 | $1,646 | $78,700 | $11,500 | $67,200 |
Source: Public Records
Map
Nearby Homes
- 2021 E 25th St
- 2216 Lay St
- 1821 E 25th St
- 2322 Guthrie Ave
- 2112 E 23rd St
- 1901 E 23rd St
- 2124 E 23rd St
- 2323 E 23rd St
- 1905 Searle St
- 2100 Searle St
- 2324 E 23rd St
- 2503 E 24th St
- 1915 E 22nd St
- 2645 Wisconsin Ave
- 2208 Tichenor St
- 1614 Searle St
- 1603 Searle St
- 1601 E 22nd St
- 2757 Easton Blvd
- 2809 E 24th St