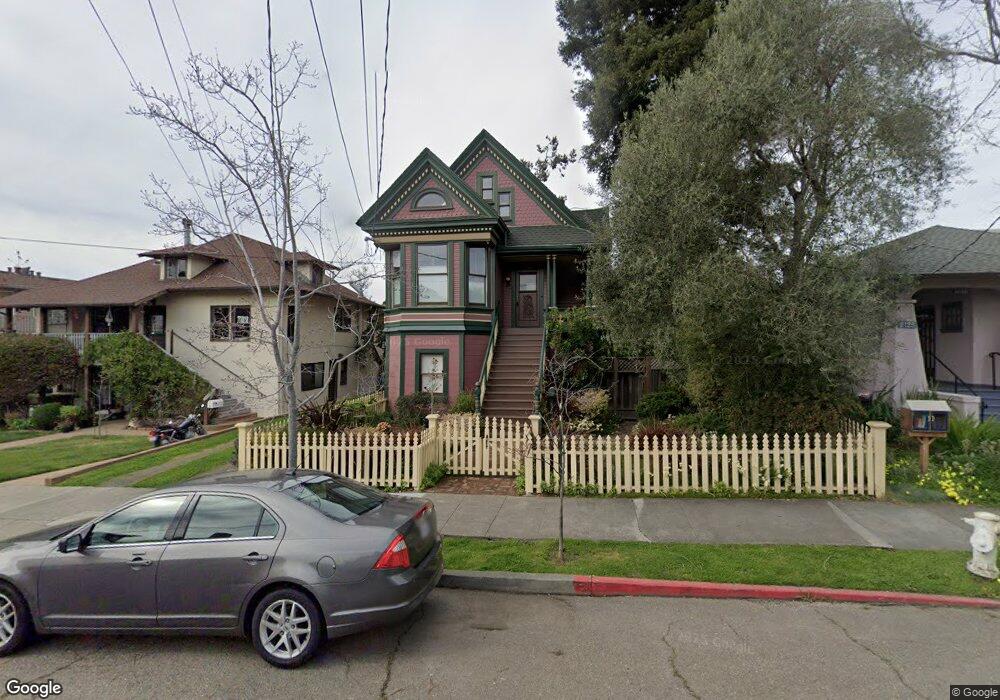
2123 Russell St Berkeley, CA 94705
South Berkeley NeighborhoodEstimated Value: $1,480,000 - $2,160,000
7
Beds
3
Baths
2,819
Sq Ft
$668/Sq Ft
Est. Value
About This Home
This home is located at 2123 Russell St, Berkeley, CA 94705 and is currently estimated at $1,882,829, approximately $667 per square foot. 2123 Russell St is a home located in Alameda County with nearby schools including Malcolm X Elementary School, Emerson Elementary School, and John Muir Elementary School.
Ownership History
Date
Name
Owned For
Owner Type
Purchase Details
Closed on
Aug 20, 2025
Sold by
Jennifer Ware Revocable Trust and Andra Mitchell Revocable Trust
Bought by
Ware And Mitchell Revocable Trust and Ware
Current Estimated Value
Purchase Details
Closed on
Aug 26, 2010
Sold by
Ware Jennifer and Ware Jennifer L
Bought by
Ware Jennifer and The Jennifer Ware Revocable Tr
Purchase Details
Closed on
Jul 22, 2004
Sold by
Grassel Ann
Bought by
Mitchell Andra L and Ware Jennifer L
Home Financials for this Owner
Home Financials are based on the most recent Mortgage that was taken out on this home.
Original Mortgage
$793,600
Interest Rate
5.12%
Mortgage Type
Purchase Money Mortgage
Purchase Details
Closed on
Dec 29, 1995
Sold by
Grassel Keith
Bought by
Grassel Ann
Create a Home Valuation Report for This Property
The Home Valuation Report is an in-depth analysis detailing your home's value as well as a comparison with similar homes in the area
Home Values in the Area
Average Home Value in this Area
Purchase History
| Date | Buyer | Sale Price | Title Company |
|---|---|---|---|
| Ware And Mitchell Revocable Trust | -- | None Listed On Document | |
| Ware Jennifer | -- | None Available | |
| Mitchell Andra | -- | None Available | |
| Mitchell Andra L | $992,000 | Chicago Title Company | |
| Grassel Ann | -- | -- |
Source: Public Records
Mortgage History
| Date | Status | Borrower | Loan Amount |
|---|---|---|---|
| Previous Owner | Mitchell Andra L | $793,600 |
Source: Public Records
Tax History
| Year | Tax Paid | Tax Assessment Tax Assessment Total Assessment is a certain percentage of the fair market value that is determined by local assessors to be the total taxable value of land and additions on the property. | Land | Improvement |
|---|---|---|---|---|
| 2025 | $21,367 | $1,375,628 | $414,788 | $967,840 |
| 2024 | $21,367 | $1,348,527 | $406,658 | $948,869 |
| 2023 | $20,919 | $1,328,951 | $398,685 | $930,266 |
| 2022 | $20,534 | $1,295,901 | $390,870 | $912,031 |
| 2021 | $20,579 | $1,270,358 | $383,207 | $894,151 |
| 2020 | $19,440 | $1,264,264 | $379,279 | $884,985 |
| 2019 | $18,641 | $1,239,483 | $371,845 | $867,638 |
| 2018 | $18,325 | $1,215,190 | $364,557 | $850,633 |
| 2017 | $17,788 | $1,191,371 | $357,411 | $833,960 |
| 2016 | $17,208 | $1,168,020 | $350,406 | $817,614 |
| 2015 | $15,664 | $1,050,000 | $315,000 | $735,000 |
| 2014 | $13,308 | $847,000 | $254,100 | $592,900 |
Source: Public Records
Map
Nearby Homes
- 2923 Wheeler St
- 2110 Ashby Ave
- 2057 Emerson St
- 2243 Ashby Ave
- 2124 Prince St
- 3046 Deakin St
- 2319 Ward St
- 2917 Telegraph Ave
- 629 66th St
- 2018 Blake St
- 6555 Shattuck Ave
- 2702 Dana St
- 2701 Grant St
- 2926 Ellis St
- 1901 Parker St Unit 3
- 2935 Florence St
- 3033 Ellis St Unit B
- 6445 Irwin Ct
- 556 Alcatraz Ave
- 2550 Dana St Unit 2F
- 2125 Russell St
- 2121 Russell St
- 2119 Russell St
- 2127 Russell St
- 2124 Oregon St
- 2128 Oregon St
- 2129 Russell St
- 2129 Russell St
- 2132 Oregon St
- 2901 Lorina St
- 2136 Oregon St
- 2134 Oregon St
- 2140 Oregon St
- 2903 Lorina St Unit A
- 2131 Russell St
- 2106 Russell St
- 2144 Oregon St
- 2900 Wheeler St
- 2907 Lorina St
- 2133 Russell St
Your Personal Tour Guide
Ask me questions while you tour the home.