Estimated Value: $226,443 - $282,000
4
Beds
2
Baths
2,277
Sq Ft
$110/Sq Ft
Est. Value
About This Home
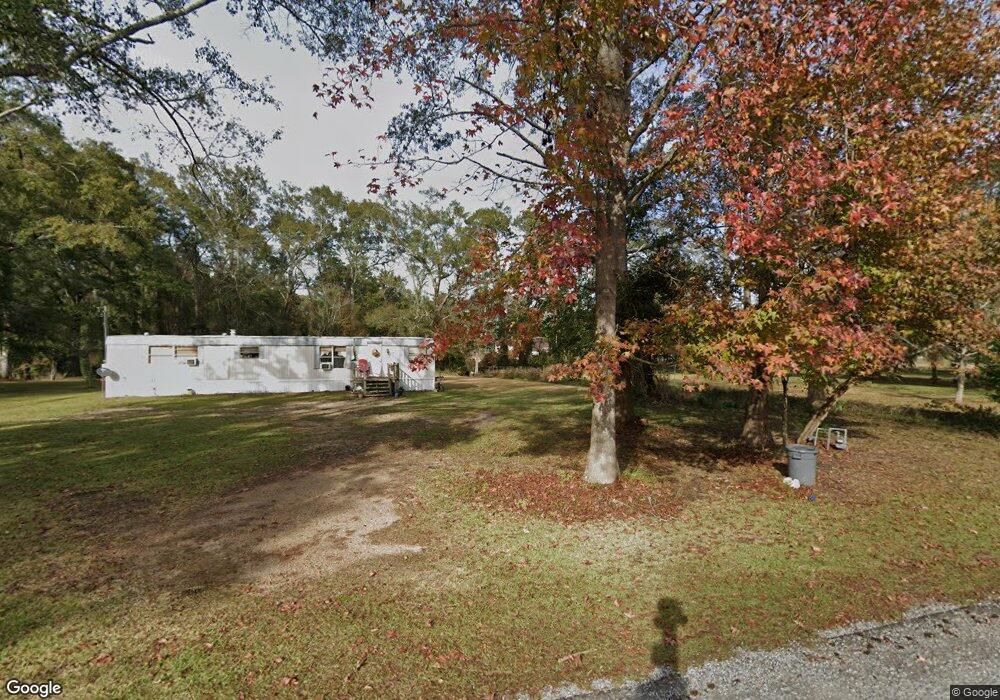
This home is located at 2123 Scr 64, Mize, MS 39116 and is currently estimated at $251,148, approximately $110 per square foot. 2123 Scr 64 is a home located in Smith County with nearby schools including Mize Attendance Center.
Ownership History
Date
Name
Owned For
Owner Type
Purchase Details
Closed on
Oct 31, 2014
Sold by
Mcguire Jerry and Mcguire Bethany
Bought by
Cook Michael E and Cook Tiffany B
Current Estimated Value
Home Financials for this Owner
Home Financials are based on the most recent Mortgage that was taken out on this home.
Original Mortgage
$157,080
Outstanding Balance
$120,786
Interest Rate
4.26%
Mortgage Type
New Conventional
Estimated Equity
$130,362
Purchase Details
Closed on
Sep 21, 2011
Sold by
Butler Ronald E and Butler Alisa J
Bought by
Mcguire Jerry and Mcguire Bethany
Home Financials for this Owner
Home Financials are based on the most recent Mortgage that was taken out on this home.
Original Mortgage
$133,600
Interest Rate
4.38%
Create a Home Valuation Report for This Property
The Home Valuation Report is an in-depth analysis detailing your home's value as well as a comparison with similar homes in the area
Purchase History
| Date | Buyer | Sale Price | Title Company |
|---|---|---|---|
| Cook Michael E | -- | -- | |
| Mcguire Jerry | -- | -- |
Source: Public Records
Mortgage History
| Date | Status | Borrower | Loan Amount |
|---|---|---|---|
| Open | Cook Michael E | $157,080 | |
| Previous Owner | Mcguire Jerry | $133,600 | |
| Previous Owner | Mcguire Jerry | $171,283 |
Source: Public Records
Tax History
| Year | Tax Paid | Tax Assessment Tax Assessment Total Assessment is a certain percentage of the fair market value that is determined by local assessors to be the total taxable value of land and additions on the property. | Land | Improvement |
|---|---|---|---|---|
| 2025 | $1,011 | $12,792 | $0 | $0 |
| 2024 | $740 | $10,146 | $0 | $0 |
| 2023 | $747 | $10,209 | $0 | $0 |
| 2022 | $747 | $10,216 | $0 | $0 |
| 2021 | $740 | $10,226 | $0 | $0 |
| 2020 | $658 | $9,600 | $0 | $0 |
| 2019 | $659 | $9,609 | $0 | $0 |
| 2018 | $658 | $9,604 | $0 | $0 |
| 2017 | $658 | $9,599 | $0 | $0 |
| 2016 | $603 | $9,178 | $0 | $0 |
| 2015 | -- | $9,160 | $0 | $0 |
| 2014 | -- | $9,145 | $0 | $0 |
Source: Public Records
Map
Nearby Homes
- 0 Scr 73-A Unit 142818
- 108 Brumley Ln
- 485 Scr 62
- 0 County Road 77
- 208 & 208B Cedar St
- 226 N Oak St
- 0 County Road 63
- 0 Mississippi 35
- 0 Highway 28 Unit 4124757
- 0 Highway 28 Unit 144030
- 33 Scr 50a1
- 3381 Scr 79
- 0 Bryant Ln
- 1138 Scr 18
- 02 Highway 28
- 0 Hosey Rd
- 1063 Dry Creek Rd
- 1333 Scr 51
- 1847 Smith County Road 123