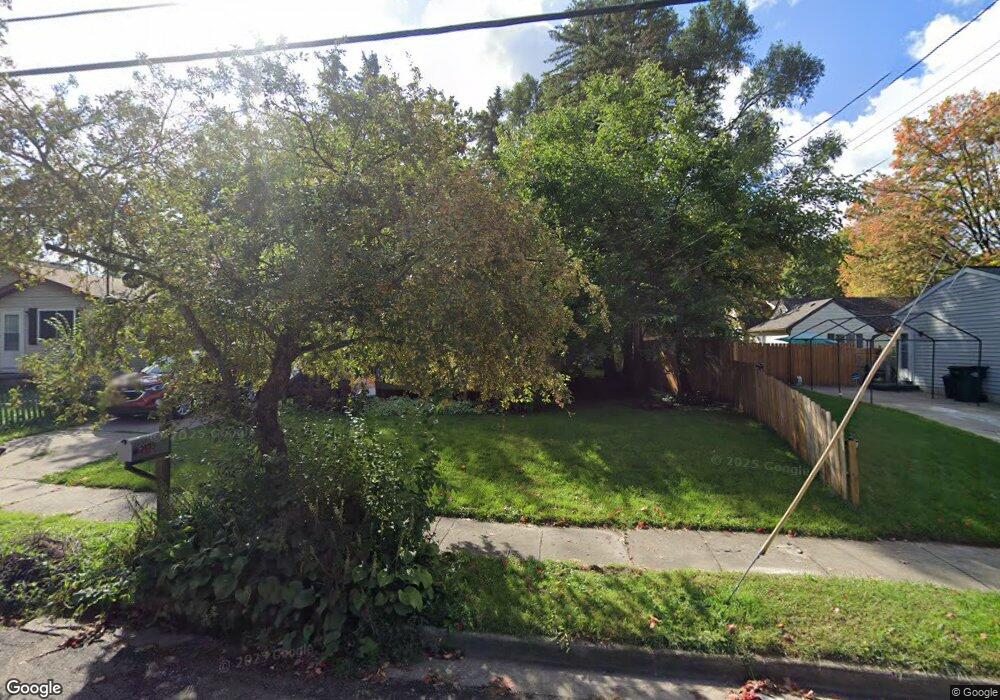
2123 Webster St Lansing, MI 48911
Southern Lansing NeighborhoodEstimated Value: $134,627 - $185,000
Studio
--
Bath
960
Sq Ft
$158/Sq Ft
Est. Value
About This Home
This home is located at 2123 Webster St, Lansing, MI 48911 and is currently estimated at $151,657, approximately $157 per square foot. 2123 Webster St is a home located in Ingham County with nearby schools including Reo Elementary School, Attwood School, and Everett High School.
Ownership History
Date
Name
Owned For
Owner Type
Purchase Details
Closed on
Jun 13, 2007
Sold by
Montague Dennis and Montague Nancy
Bought by
S & S Acquisitions Group Llc
Current Estimated Value
Purchase Details
Closed on
Apr 5, 2007
Sold by
Montague Dennis and Montague Nancy
Bought by
Household Finance Corp Iii
Purchase Details
Closed on
Aug 22, 2002
Sold by
Household Finance Corp Iii
Bought by
Montague Dennis
Home Financials for this Owner
Home Financials are based on the most recent Mortgage that was taken out on this home.
Original Mortgage
$72,000
Interest Rate
10.35%
Mortgage Type
Purchase Money Mortgage
Purchase Details
Closed on
Nov 29, 2001
Sold by
Brand Kelly J and Matson John
Bought by
Household Finance Corp Iii
Create a Home Valuation Report for This Property
The Home Valuation Report is an in-depth analysis detailing your home's value as well as a comparison with similar homes in the area
Home Values in the Area
Average Home Value in this Area
Purchase History
| Date | Buyer | Sale Price | Title Company |
|---|---|---|---|
| S & S Acquisitions Group Llc | -- | None Available | |
| Household Finance Corp Iii | $39,811 | None Available | |
| Montague Dennis | $72,000 | -- | |
| Household Finance Corp Iii | $67,680 | -- |
Source: Public Records
Mortgage History
| Date | Status | Borrower | Loan Amount |
|---|---|---|---|
| Previous Owner | Montague Dennis | $72,000 |
Source: Public Records
Tax History
| Year | Tax Paid | Tax Assessment Tax Assessment Total Assessment is a certain percentage of the fair market value that is determined by local assessors to be the total taxable value of land and additions on the property. | Land | Improvement |
|---|---|---|---|---|
| 2025 | $2,518 | $64,800 | $5,600 | $59,200 |
| 2024 | $21 | $51,900 | $5,600 | $46,300 |
| 2023 | $2,370 | $44,500 | $5,600 | $38,900 |
| 2022 | $2,165 | $39,100 | $3,900 | $35,200 |
| 2021 | $2,115 | $38,100 | $3,900 | $34,200 |
| 2020 | $2,100 | $34,700 | $3,900 | $30,800 |
| 2019 | $2,028 | $30,800 | $3,900 | $26,900 |
| 2018 | $1,924 | $28,200 | $3,900 | $24,300 |
| 2017 | $1,851 | $28,200 | $3,900 | $24,300 |
| 2016 | $1,778 | $26,800 | $3,900 | $22,900 |
| 2015 | $1,778 | $25,700 | $7,794 | $17,906 |
| 2014 | $1,778 | $23,400 | $12,124 | $11,276 |
Source: Public Records
Map
Nearby Homes
- 5838 S Martin Luther King Junior Blvd
- 2411 Bliesener St
- 5650 Hughes Rd
- 6037 Hughes Rd
- 5902 Haag Rd
- 1406 Weymouth Ct
- 1309 Penrod Ct
- 3220 W Miller Rd
- 5641 Ashley Dr
- 2416 Midwood St
- 2918 Midwood St
- 0 Midwood St
- 1020 R G Curtiss Ave
- 2706 W Jolly Rd
- 5017 Christiansen Rd
- 4928 Hughes Rd
- 4927 Starr Ave
- 1006 Attwood Dr
- 826 R G Curtiss Ave
- 1001 Ferley St
Your Personal Tour Guide
Ask me questions while you tour the home.