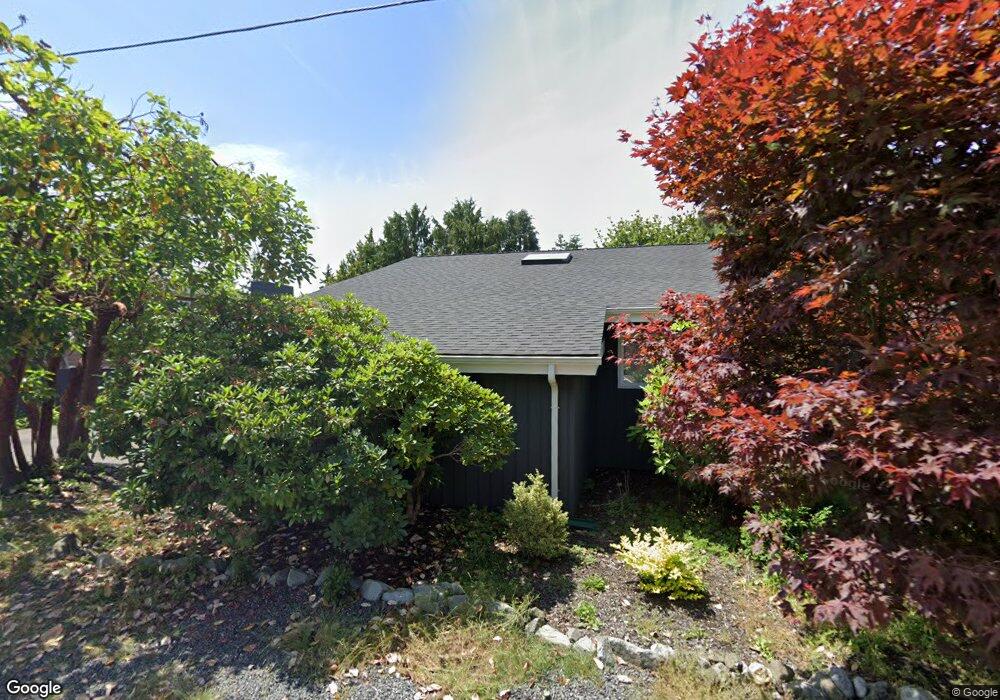
21230 92nd Place W Edmonds, WA 98020
Chase Lake NeighborhoodEstimated Value: $1,509,000 - $1,591,423
5
Beds
3
Baths
3,836
Sq Ft
$403/Sq Ft
Est. Value
About This Home
This home is located at 21230 92nd Place W, Edmonds, WA 98020 and is currently estimated at $1,546,606, approximately $403 per square foot. 21230 92nd Place W is a home located in Snohomish County with nearby schools including Westgate Elementary School, College Place Middle School, and Edmonds-Woodway High School.
Ownership History
Date
Name
Owned For
Owner Type
Purchase Details
Closed on
Nov 28, 2022
Sold by
Redfinnow Borrower Llc
Bought by
Crites Ralston Larae and Jennings Ethan
Current Estimated Value
Home Financials for this Owner
Home Financials are based on the most recent Mortgage that was taken out on this home.
Original Mortgage
$1,124,625
Outstanding Balance
$1,090,878
Interest Rate
6.95%
Mortgage Type
New Conventional
Estimated Equity
$455,728
Purchase Details
Closed on
May 12, 2021
Sold by
Cary Thomas and Ruogruangkonkit Sangjan
Bought by
Redfinnew Borrower Llc
Purchase Details
Closed on
Feb 24, 2000
Sold by
Munar Manolo C and Munar Genevieve D
Bought by
Cary Thomas R and Rungruangkonkit Sangjan
Home Financials for this Owner
Home Financials are based on the most recent Mortgage that was taken out on this home.
Original Mortgage
$215,900
Interest Rate
8.16%
Create a Home Valuation Report for This Property
The Home Valuation Report is an in-depth analysis detailing your home's value as well as a comparison with similar homes in the area
Home Values in the Area
Average Home Value in this Area
Purchase History
| Date | Buyer | Sale Price | Title Company |
|---|---|---|---|
| Crites Ralston Larae | -- | None Listed On Document | |
| Redfinnew Borrower Llc | $730,000 | None Available | |
| Cary Thomas R | $239,900 | -- |
Source: Public Records
Mortgage History
| Date | Status | Borrower | Loan Amount |
|---|---|---|---|
| Open | Crites Ralston Larae | $1,124,625 | |
| Previous Owner | Cary Thomas R | $215,900 |
Source: Public Records
Tax History Compared to Growth
Tax History
| Year | Tax Paid | Tax Assessment Tax Assessment Total Assessment is a certain percentage of the fair market value that is determined by local assessors to be the total taxable value of land and additions on the property. | Land | Improvement |
|---|---|---|---|---|
| 2025 | $8,495 | $1,204,500 | $571,000 | $633,500 |
| 2024 | $8,495 | $1,192,500 | $559,000 | $633,500 |
| 2023 | $5,022 | $730,000 | $584,000 | $146,000 |
| 2022 | $5,393 | $644,800 | $452,000 | $192,800 |
| 2020 | $5,128 | $548,300 | $355,000 | $193,300 |
| 2019 | $4,737 | $510,200 | $326,000 | $184,200 |
| 2018 | $4,758 | $442,900 | $278,000 | $164,900 |
| 2017 | $3,971 | $386,700 | $241,000 | $145,700 |
| 2016 | $3,657 | $352,800 | $213,000 | $139,800 |
| 2015 | $3,414 | $310,100 | $204,000 | $106,100 |
| 2013 | $2,840 | $243,200 | $138,000 | $105,200 |
Source: Public Records
Map
Nearby Homes
- 21232 92nd Place W
- 9533 Bowdoin Way
- 1021 Walnut St
- 8804 209th Place SW
- 8732 209th Place SW
- 21703 97th Ave W
- 8500 Main St Unit F313
- 8500 Main St Unit F-209
- 8500 Main St Unit F205
- 228 xx 84th Ave W
- 7522 221st St SW
- 816 Walnut St
- 21505 84th Ave W
- 21224 82nd Place W
- 8225 212th St SW Unit 304
- 22039 98th Place W
- 1221 Coronado Place
- 22212 98th Ave W
- 20721 81st Ave W
- 7924 212th St SW Unit 211
- 21220 92nd Place W
- 21231 92nd Place W
- 92 XX 92nd Place W
- 92 XX 92nd Place W
- 0 XXX 92nd Place W
- 213 92nd Place W
- 21217 92nd Place W
- 9309 Bowdoin Way
- 9215 Bowdoin Way
- 21215 92nd Place W
- 21235 92nd Place W
- 9232 Bowdoin Way
- 21202 92nd Place W
- 21303 93rd Place W
- 9207 Park Rd
- 21211 92nd Place W
- 21308 92nd Place W
- 9325 Bowdoin Way
- 9205 Park Rd
- 21309 93rd Place W