Estimated Value: $1,149,366 - $1,307,000
4
Beds
3
Baths
2,103
Sq Ft
$577/Sq Ft
Est. Value
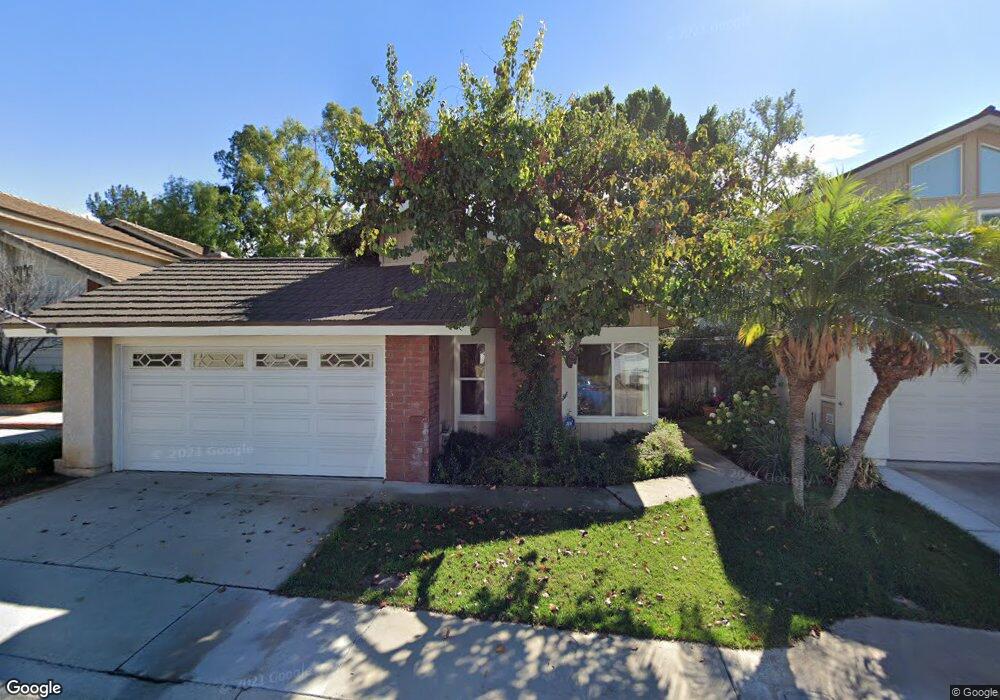
About This Home
This home is located at 2124 Arbor Cir, Brea, CA 92821 and is currently estimated at $1,213,592, approximately $577 per square foot. 2124 Arbor Cir is a home located in Orange County with nearby schools including Brea Country Hills Elementary School, Brea Junior High School, and Brea-Olinda High School.
Ownership History
Date
Name
Owned For
Owner Type
Purchase Details
Closed on
Dec 20, 2023
Sold by
Green Douglas and Green Brenda L
Bought by
Green Trust and Green
Current Estimated Value
Purchase Details
Closed on
Nov 21, 1997
Sold by
Green Doug and Green Brenda L
Bought by
Green Douglas E and Green Brenda L
Home Financials for this Owner
Home Financials are based on the most recent Mortgage that was taken out on this home.
Original Mortgage
$168,000
Interest Rate
7.33%
Mortgage Type
Purchase Money Mortgage
Purchase Details
Closed on
Jul 24, 1996
Sold by
Dolores Cobb Bruce J
Bought by
Green Doug and Green Brenda L
Home Financials for this Owner
Home Financials are based on the most recent Mortgage that was taken out on this home.
Original Mortgage
$168,050
Interest Rate
8.18%
Mortgage Type
Purchase Money Mortgage
Purchase Details
Closed on
Aug 16, 1993
Sold by
Cobb Bruce J and Cobb Donna M
Bought by
Cobb Bruce J and Cobb Donna M
Create a Home Valuation Report for This Property
The Home Valuation Report is an in-depth analysis detailing your home's value as well as a comparison with similar homes in the area
Home Values in the Area
Average Home Value in this Area
Purchase History
| Date | Buyer | Sale Price | Title Company |
|---|---|---|---|
| Green Trust | -- | None Listed On Document | |
| Green Douglas E | -- | Fidelity National Title Ins | |
| Green Doug | $176,000 | Orange Coast Title | |
| Green Doug | -- | Orange Coast Title | |
| Cobb Bruce J | -- | -- |
Source: Public Records
Mortgage History
| Date | Status | Borrower | Loan Amount |
|---|---|---|---|
| Previous Owner | Green Douglas E | $168,000 | |
| Previous Owner | Green Doug | $168,050 |
Source: Public Records
Tax History
| Year | Tax Paid | Tax Assessment Tax Assessment Total Assessment is a certain percentage of the fair market value that is determined by local assessors to be the total taxable value of land and additions on the property. | Land | Improvement |
|---|---|---|---|---|
| 2025 | $4,426 | $375,403 | $161,915 | $213,488 |
| 2024 | $4,426 | $368,043 | $158,741 | $209,302 |
| 2023 | $4,303 | $360,827 | $155,628 | $205,199 |
| 2022 | $4,260 | $353,752 | $152,576 | $201,176 |
| 2021 | $3,837 | $315,513 | $149,584 | $165,929 |
| 2020 | $4,076 | $343,261 | $148,051 | $195,210 |
| 2019 | $3,969 | $336,531 | $145,148 | $191,383 |
| 2018 | $3,908 | $329,933 | $142,302 | $187,631 |
| 2017 | $3,834 | $323,464 | $139,512 | $183,952 |
| 2016 | $3,758 | $317,122 | $136,776 | $180,346 |
| 2015 | $3,705 | $312,359 | $134,721 | $177,638 |
| 2014 | -- | $306,241 | $132,082 | $174,159 |
Source: Public Records
Map
Nearby Homes
- 136 Donnybrook Rd
- 2304 Carrotwood Dr
- 2257 Shadetree Cir
- 2418 Rainbow Ln
- 2583 Sandpebble Ln
- 1975 Heather Cir
- 2440 Sanabria Ln
- 341 Adalina Ln
- 520 N Bardsdale Place
- 2761 E Stearns St
- 570 Olive Ave
- 198 Sunflower St
- 688 Buttonwood Dr
- 2849 Tarragon Ct
- 3023 Limewood Ct
- 3112 E Piru Ln
- 3174 E Piru Ln
- 2851 Rolling Hills Dr Unit 178
- 2851 Rolling Hills Dr Unit 257
- 2851 Rolling Hills Dr Unit 248
- 2132 Arbor Cir
- 2110 Arbor Cir
- 2138 Arbor Cir
- 2102 Arbor Cir
- 2146 Arbor Cir
- 2117 Arbor Cir
- 2100 Arbor Cir
- 2125 Arbor Cir
- 2109 Arbor Cir
- 2150 Arbor Cir
- 2139 Arbor Cir
- 2101 Arbor Cir
- 2157 Arbor Cir
- 2166 Arbor Cir
- 2116 Fallingleaf Cir
- 2108 Fallingleaf Cir
- 101 Cinnamon Ridge Rd
- 2169 Arbor Cir
- 2124 Fallingleaf Cir
- 2174 Arbor Cir
Your Personal Tour Guide
Ask me questions while you tour the home.