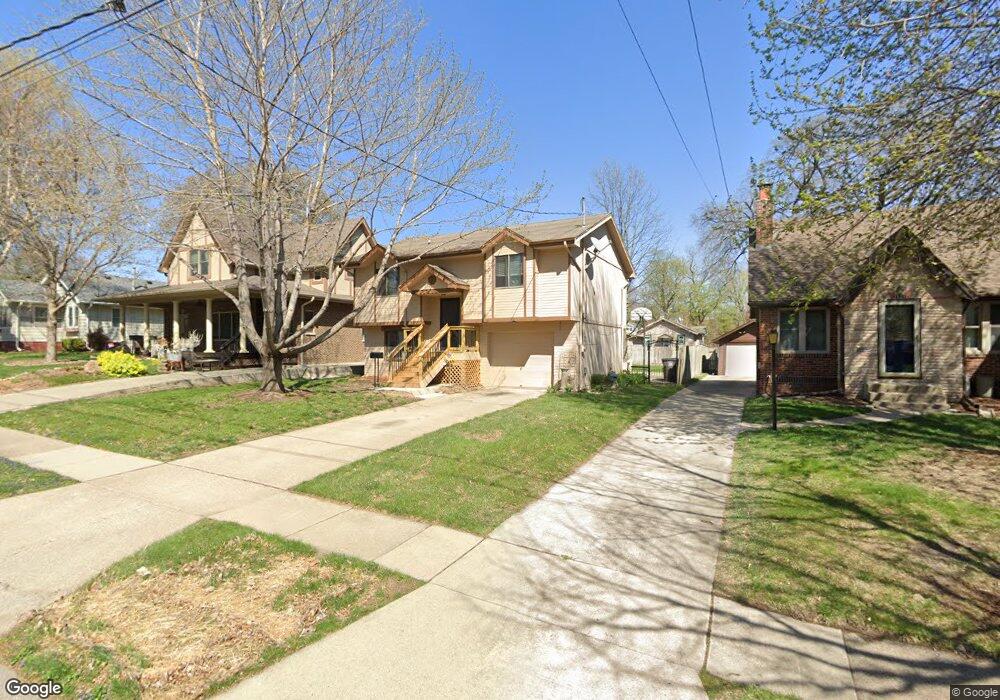
2125 40th St Des Moines, IA 50310
Beaverdale NeighborhoodEstimated Value: $250,930 - $298,000
3
Beds
2
Baths
1,172
Sq Ft
$229/Sq Ft
Est. Value
About This Home
This home is located at 2125 40th St, Des Moines, IA 50310 and is currently estimated at $267,983, approximately $228 per square foot. 2125 40th St is a home located in Polk County with nearby schools including Perkins Elementary School, Merrill Middle School, and Roosevelt High School.
Ownership History
Date
Name
Owned For
Owner Type
Purchase Details
Closed on
Jul 13, 2006
Sold by
Sikkink Steven J and Sikkink Penny R
Bought by
Hestbech Phillip and Benson Hestbech Linda
Current Estimated Value
Home Financials for this Owner
Home Financials are based on the most recent Mortgage that was taken out on this home.
Original Mortgage
$146,160
Outstanding Balance
$86,697
Interest Rate
6.73%
Mortgage Type
FHA
Estimated Equity
$181,286
Create a Home Valuation Report for This Property
The Home Valuation Report is an in-depth analysis detailing your home's value as well as a comparison with similar homes in the area
Home Values in the Area
Average Home Value in this Area
Purchase History
| Date | Buyer | Sale Price | Title Company |
|---|---|---|---|
| Hestbech Phillip | $151,500 | Itc |
Source: Public Records
Mortgage History
| Date | Status | Borrower | Loan Amount |
|---|---|---|---|
| Open | Hestbech Phillip | $146,160 |
Source: Public Records
Tax History Compared to Growth
Tax History
| Year | Tax Paid | Tax Assessment Tax Assessment Total Assessment is a certain percentage of the fair market value that is determined by local assessors to be the total taxable value of land and additions on the property. | Land | Improvement |
|---|---|---|---|---|
| 2025 | $4,068 | $246,900 | $45,600 | $201,300 |
| 2024 | $4,068 | $225,900 | $41,000 | $184,900 |
| 2023 | $4,262 | $225,900 | $41,000 | $184,900 |
| 2022 | $4,226 | $193,100 | $36,200 | $156,900 |
| 2021 | $4,116 | $193,100 | $36,200 | $156,900 |
| 2020 | $4,268 | $176,800 | $33,100 | $143,700 |
| 2019 | $3,968 | $176,800 | $33,100 | $143,700 |
| 2018 | $3,920 | $159,400 | $29,500 | $129,900 |
| 2017 | $3,772 | $159,400 | $29,500 | $129,900 |
| 2016 | $3,666 | $151,200 | $25,800 | $125,400 |
| 2015 | $3,666 | $151,200 | $25,800 | $125,400 |
| 2014 | $3,218 | $138,000 | $23,400 | $114,600 |
Source: Public Records
Map
Nearby Homes